|
|
|
|
|
Introduction Definition of Terms internal-fragmentation external-fragmentation standard formulation fragmentationX fragmented path Link to my old page Copyright and Contact |
|
|
|
Description download |
|
|
|
Description download |
|
|
|
|
|
|
|
|
|
Description download |
|
|
|
Description download Measurements on 2.4.8 Measurements on 2.4.10 |
|
|
|
Filesystem Homepages ReiserFS Ext2FS Ext3FS XFS JFS Benchmarks & Results ReiserFS benchs Denis'+Kresimir's site Randy's tests Yves' YAFB tests Literature Smith's site My master thesis |
|
|
Last changes:
Do Feb  5 09:40:02 CET 2004
|
|
Description
To measure the gauge performance -this time for reading and writing-- of the file systems for my test system and test program (eg. agesystem) I did arrange the following setup as a shell script- Choose a set of file systems to test (eg. reiser, reiser -o notail and ext2)
- Choose the directory structure for agesystem (eg. -c 100:1000 for a 100x10 structure)
- Choose the file size distribution for agesystem (eg. the standard for a 1 GB partition)
- Loop over the file systems to test,
- Loop over the -u option (usage) of 25, 50, 75 and 99 percent for agesystem
- Run agesystem with the set of chosen options
- Run fibmap to get the written block layout
- Run read to measure the read performance
- Loop over the -u option (usage) of 25, 50, 75 and 99 percent for agesystem
Download
You may download the necessary files and try it yourself. After downloading the package create a directory where to untargz it. You probably need to adjust some paths, then type ''make agesystem; make fibmap; make read'' and look for the script ''rwtest.sh'' that shows how to setup the options described above. If you like to get some graphs out of the resulting output, send the output files to me (targzed, please!).
Measurements on 2.4.5
Test System
The hardware is the same as in the agesystem section.
- AMD Duron 650 Mhz, 128 MB, 40 GB EIDE-harddisk for the system with the tests taken on
- Adaptec AHA-2940U2/W host adapter
- 9 GB IBM DNES-309170W SCSI-harddisk
- Software: SuSE 7.2 (gcc 2.95-3) kernel 2.4.5 with the following official patches
for the filesystem that were not shipped with it:
- XFS version 1.0 (06112001) for 2.4.5
- JFS version 1.0 for 2.4.5
Graphical Output Explanation
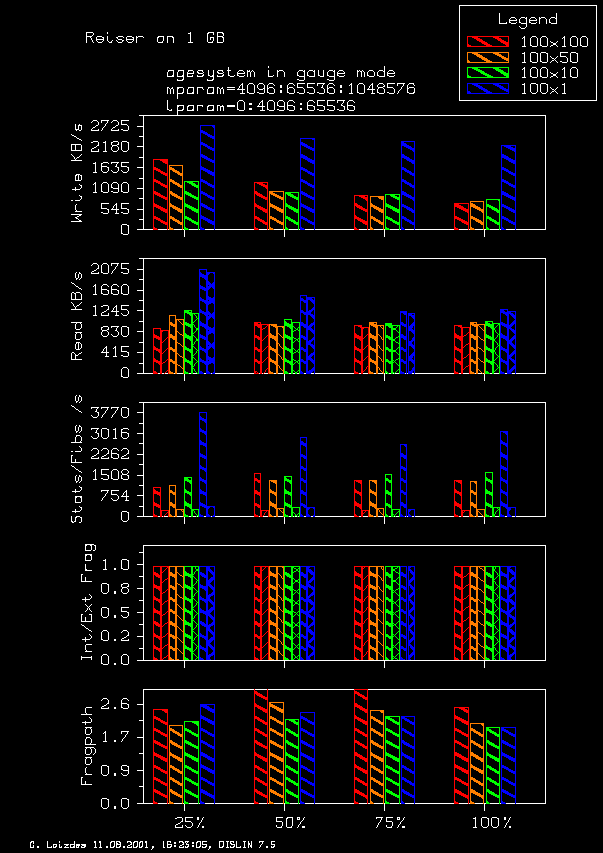
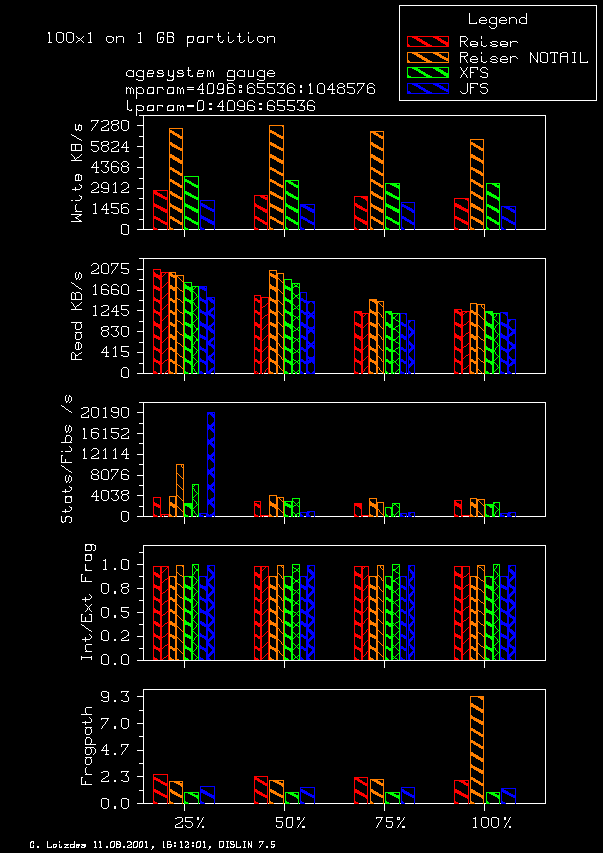
The shown graphical output is divided in 6 parts and reads as follows:- The first part consists of the legend and some remarks describing the graph as a total.
- The second part shows the absolute write performance in KB per second from the agesystem output file for 25%, 50%, 75% and 100% usage.
- The third part shows the read result for 25%, 50%, 75% and 100% usage. For each file system and usage you see two small bars. The first is the absolute read performance in KB per second measured with the timer starting just before the read system call and stopping right after it while recursively walking through all files in all directories. The second small bar should be lower than the first. It includes the time needed to traverse all files in all directories plus reading them eg. the timer is started before all file reads and stopped after the last file is read. At best for a read test the bars should not differ too much with the second bar smaller than the first.
- The forth part shows some meta data performance. The first small bar is the number of files stated (and read) during the recursive walk of read divided by the above time difference, eg. total run time of read minus accumulated read time of read which mainly is the time needed to open and read the directories plus stating the files in them. The second bar is the number of files found while fibmap recursively walks through all directories stating (and fibmaping) all files but not reading them divided by its running time. Again, the two bars should be of the same order in magnitude with the second less high than the first. At least I thought that before the measurements...
- The fifth part shows the internal fragmentation (first small bar) and the external fragmentation (second small bar) reported by fibmap.
- The sixth part shows the fragmentation path result of fibmap.
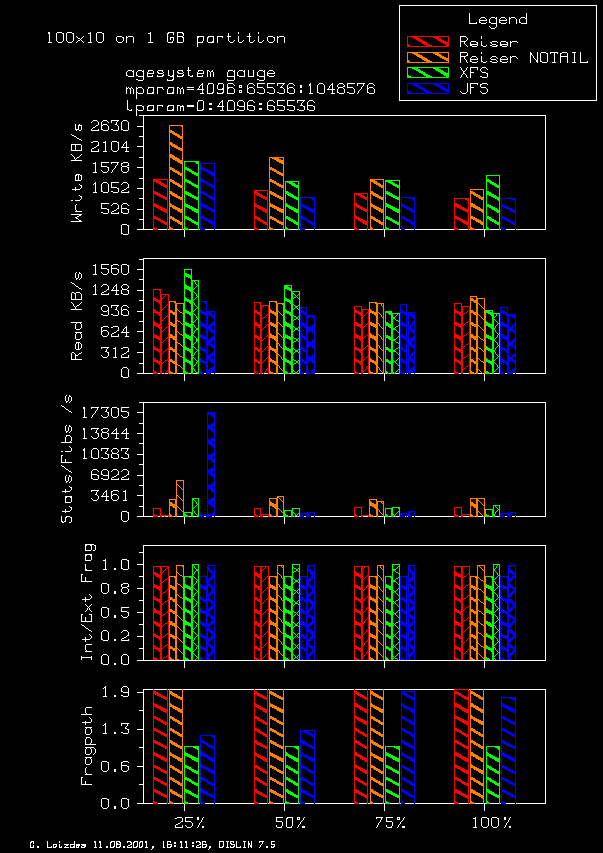
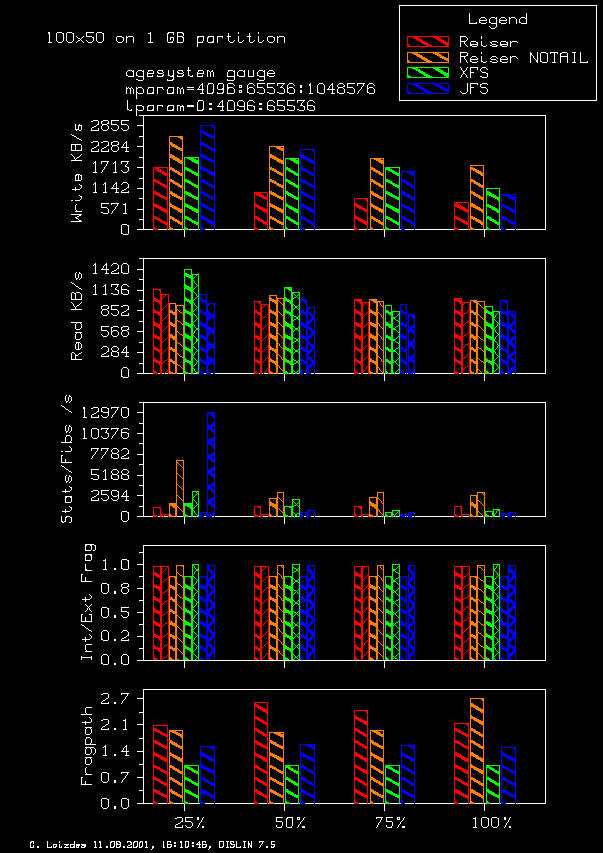
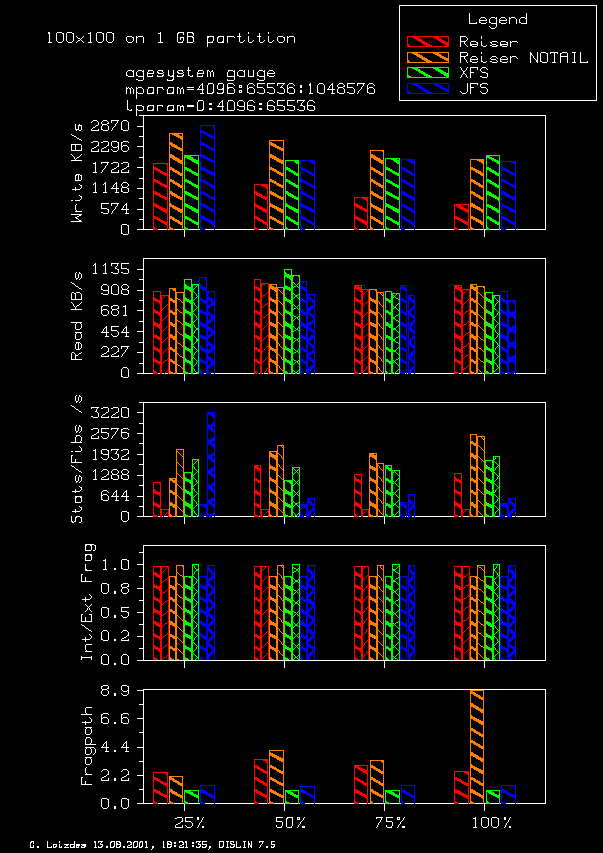
Variable File Size Results for different directory structures
In the agesystem section was shown a dependence between the write performance and the chosen directory structure. To test this again, I used the following setup:- Partition Size: 1 GB
- File systems: Reiser, Reiser with -o notail, XFS and JFS
- File size distribution: as in the agesystem section
- Directory structures: 100x1, 100x10, 100x50 and 100x100
The resulting graphs per file system comparing the different directory structures:
- ReiserFS
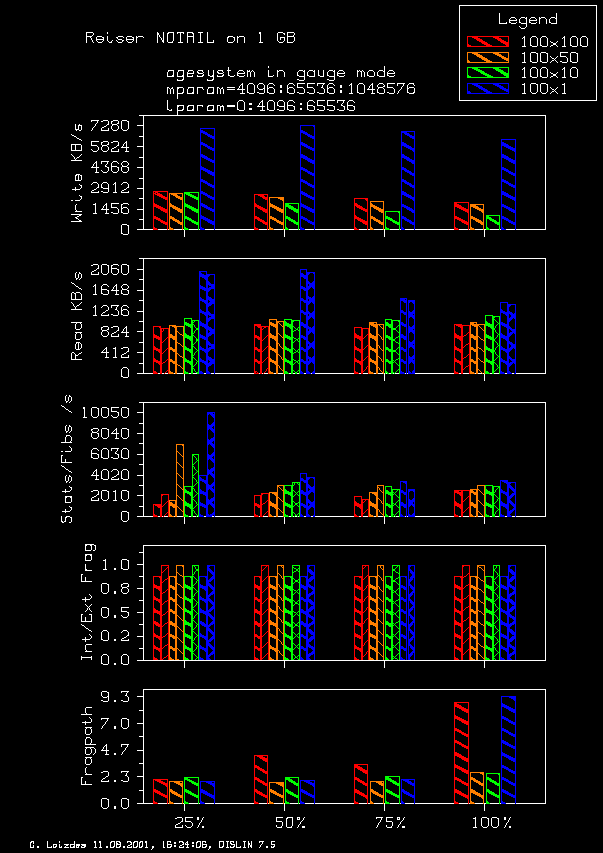
The performance ordering is clear, 100x1 is best followed by 100x10, 100x50 and 100x100 is worst. Only the write performance behaves strange up to 50 % usage. Note, that there is no internal fragmentation. - Reiser FS with notail
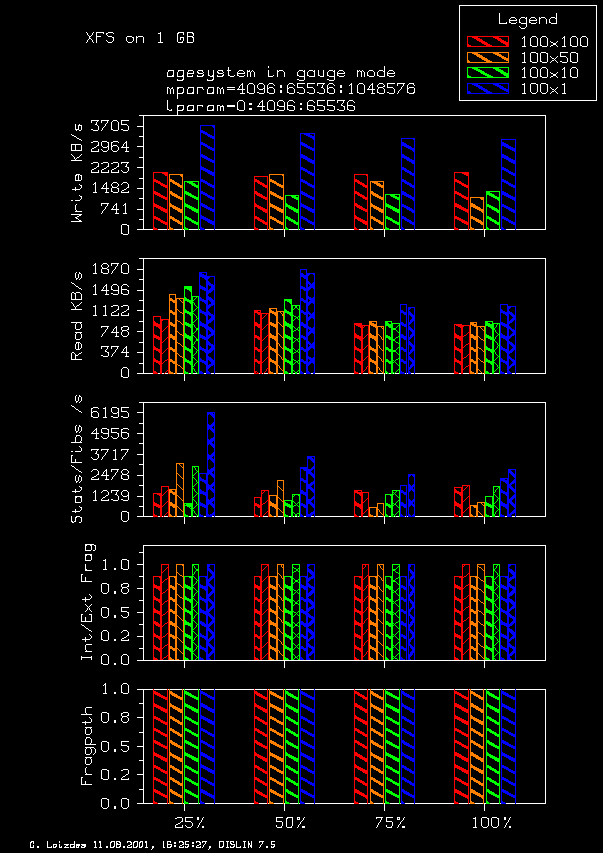
The overall picture is the same as for Reiser. But the write performance behaves even stranger: 100x100 is better than 100x50 that in turn is better 100x10 with the big jump to 100x1 which outperforms the other structures. - XFS
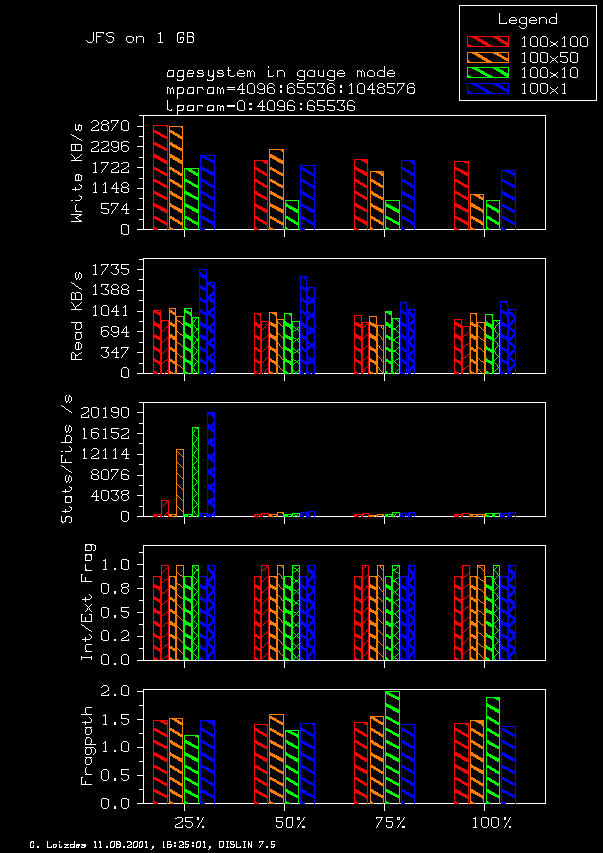
The picture is again the same as for Reiser. Note that XFS shows no external fragmentation. - JFS
Again the picture is already known. Note, that the 25 value for fibs is in all cases very high but breaks down for the fuller case.
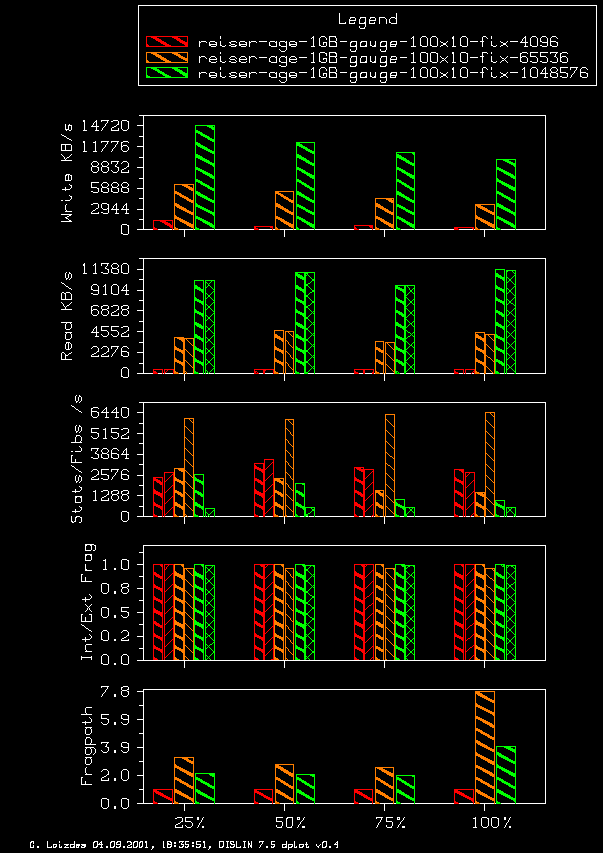
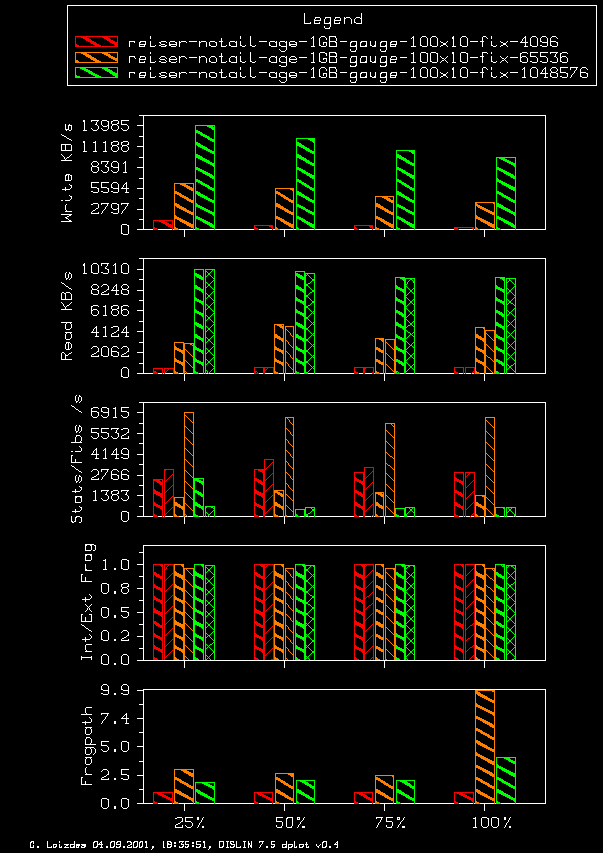
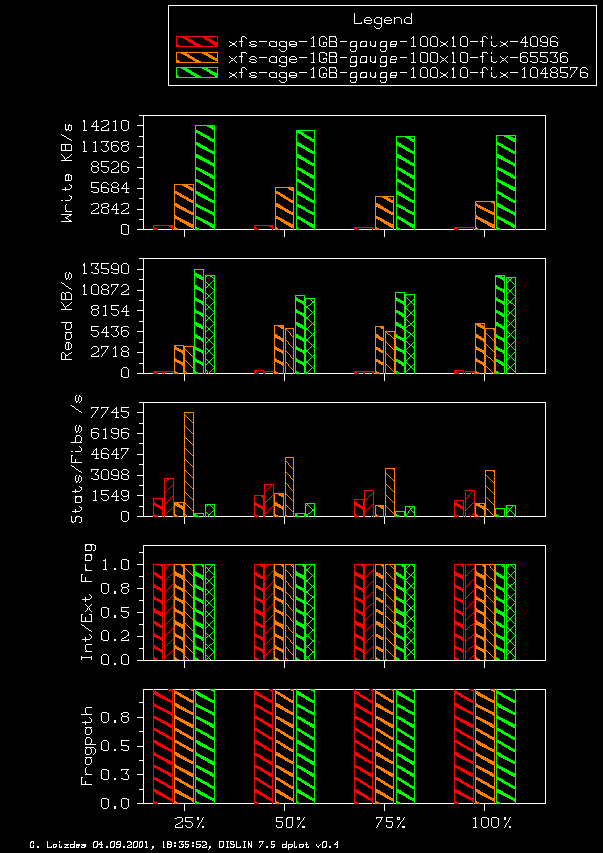
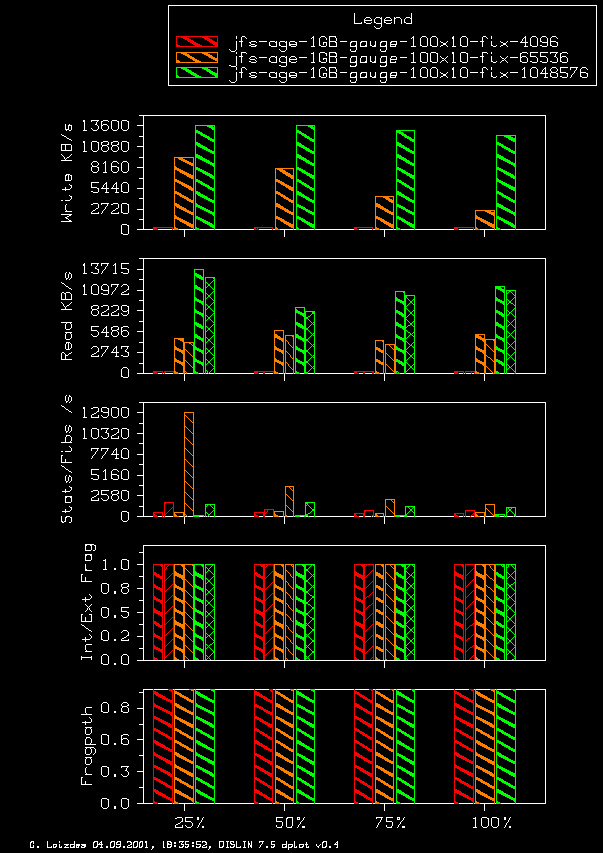
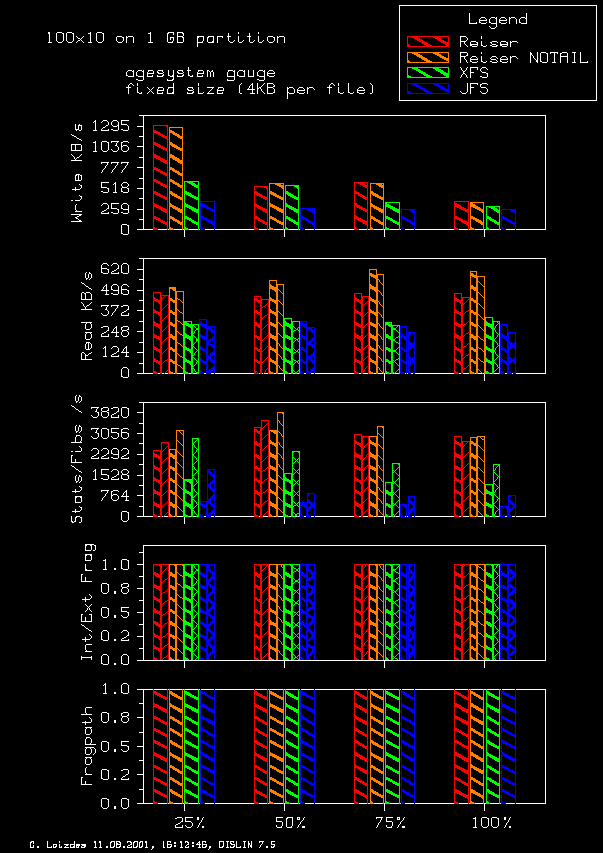
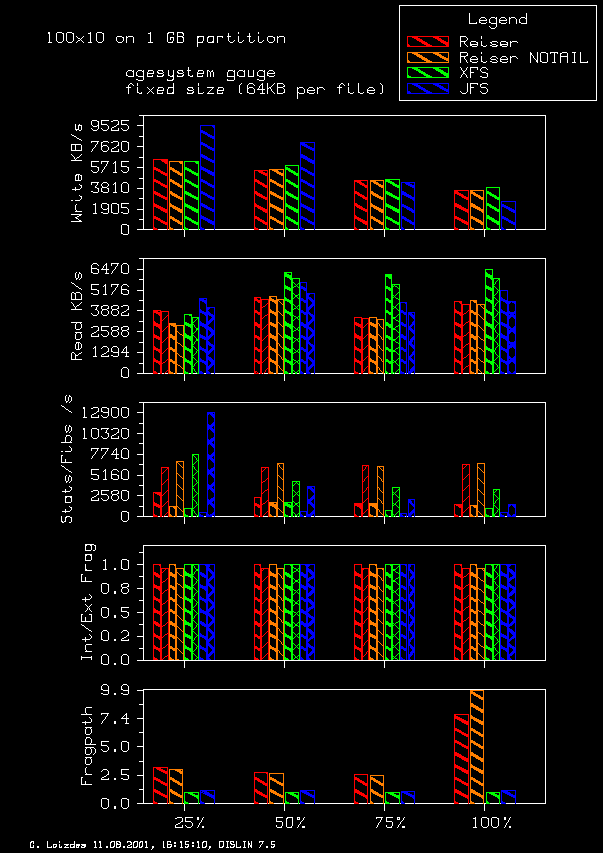
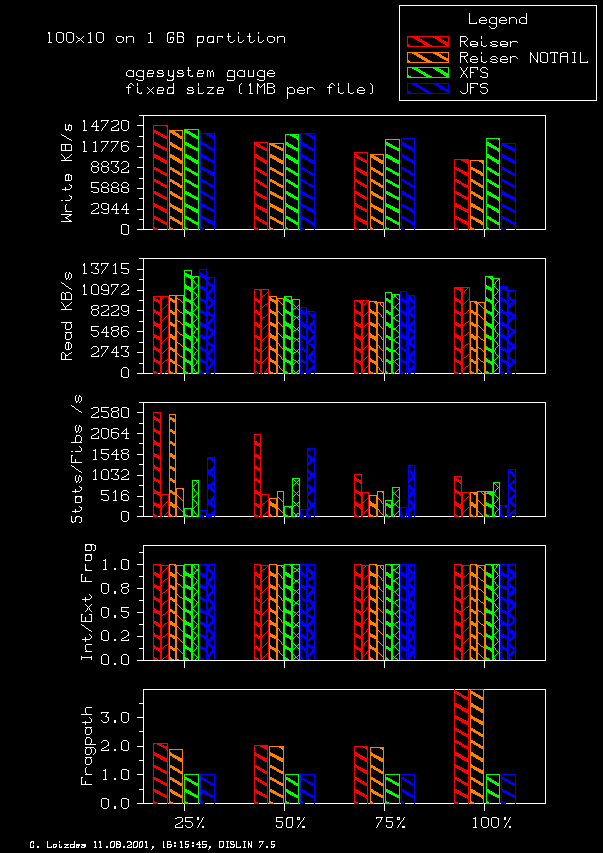
Fixed Size Results for different sizes
In this case I am creating files with a fixed size until the partition is filled. This will give a feeling of the performance of the different file size magnitudes:- Partition Size: 1 GB
- File systems: Reiser, Reiser with -o notail, XFS and JFS
- Directory structure: 100x10
- File sizes used: 4 KB, 64 KB and 1024 KB
- Reiser FS -fix- Note, there is slight external fragmentation for the mid file size range.
- Reiser FS with notail -fix- Note, there is remarkable external fragmentation for the mid file size range.
- XFS -fix-
- JFS -fix-
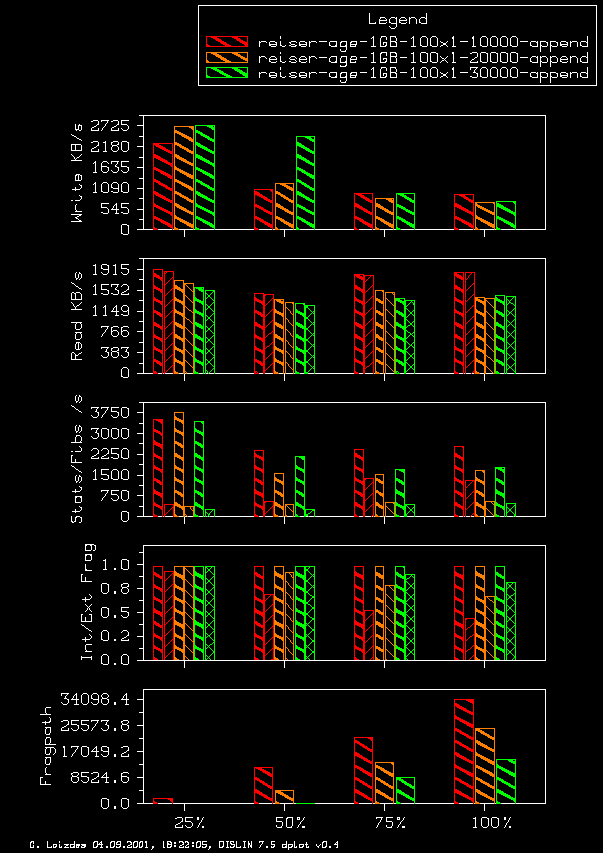
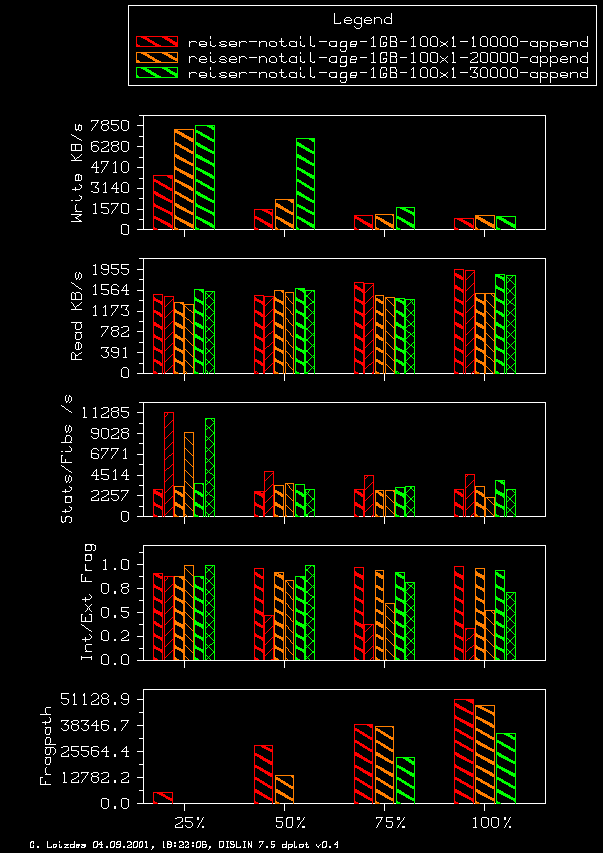
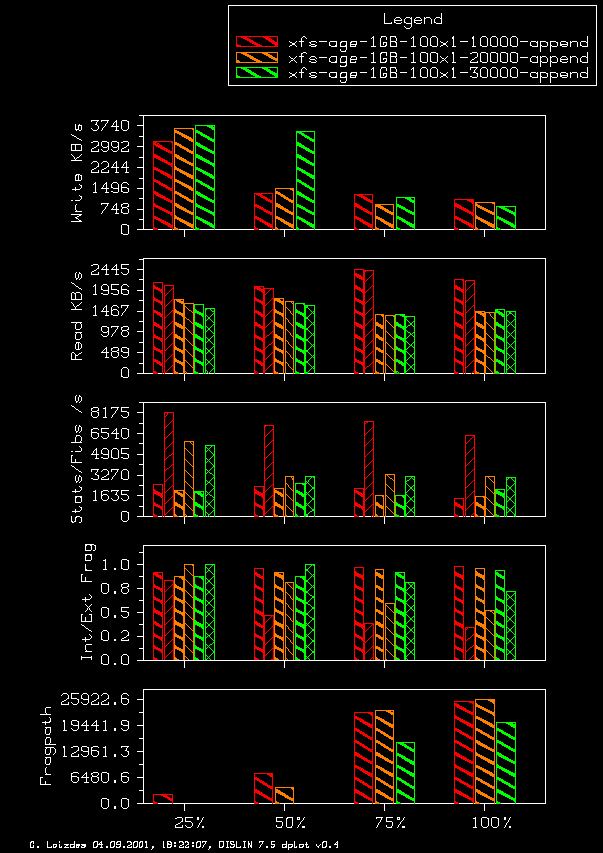
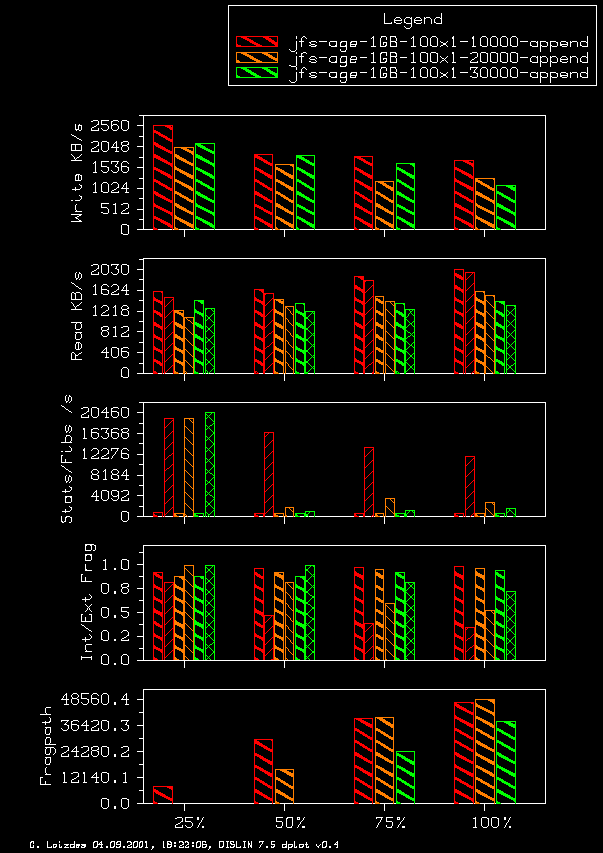
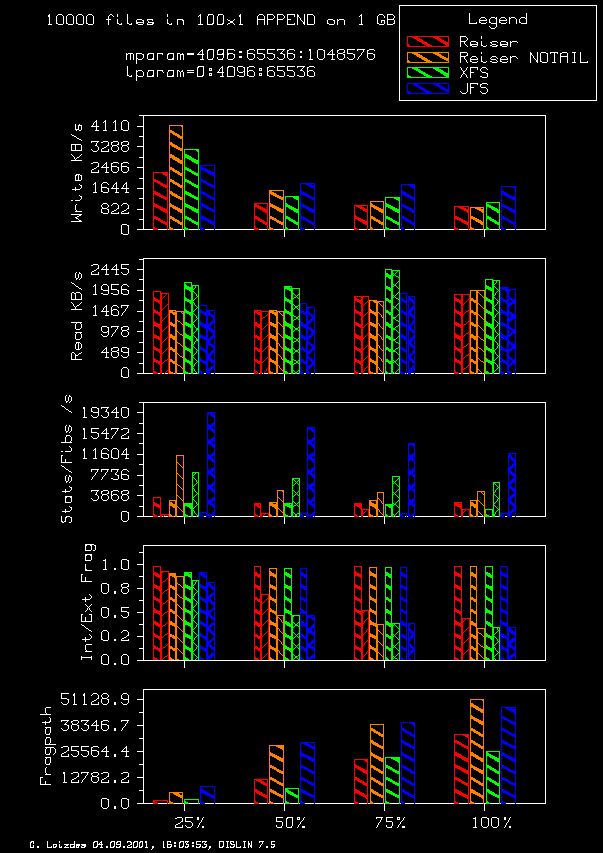
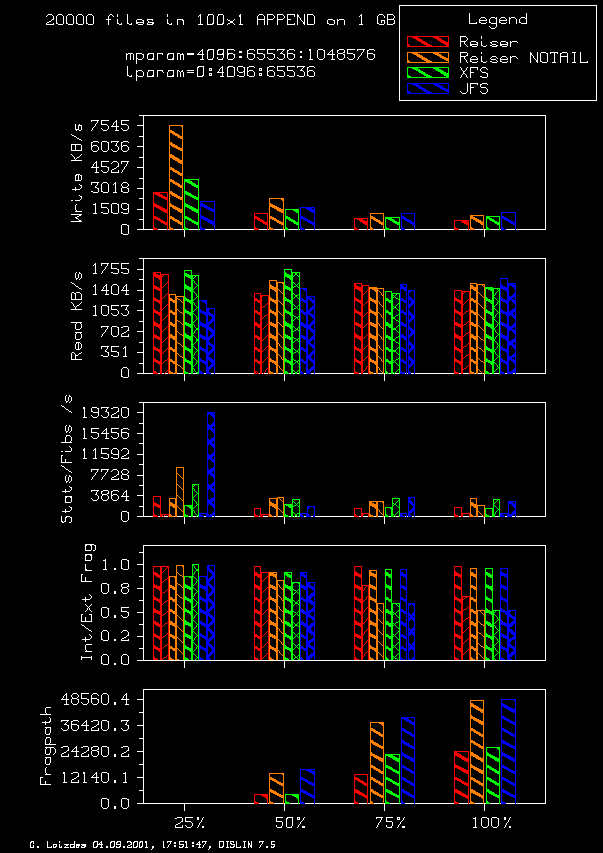
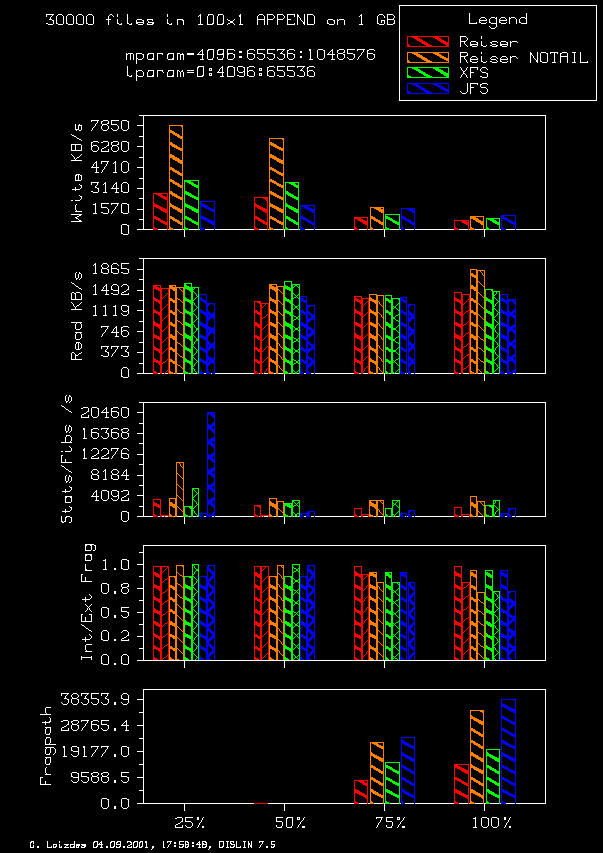
Append Variable Size Results for different number of files
In this case I am creating and then appending a maximum number of files. If the file does not exist in the first place it will be created, if it exists it will be appended. In both case the number of bytes are taken from the same distribution.- Partition Size: 1 GB
- File systems: Reiser, Reiser with -o notail, XFS and JFS
- File size distribution: as in the agesystem section
- Directory structure: 100x1
- Number of files (before first real append): 10000, 20000 and 30000
As expected, in all cases the external fragmentation becomes less with growing number of files. But the read and sometimes also the write performance do not seem to be correlated to that (abstract) number. It rather seems that the total number of files and therefore the length of each file together with the various caches (on disc and buffer/page) determines the overall performance. The resulting graphs per file system comparing the different number of files: Without comments, the resulting graphs as a comparison between the file systems: 10000 files 20000 files 30000 files
Measurements on 2.4.8-ac1
Improvements or at least changes to above measurements:- Newer kernel with a working VM (2.4.8ac1)
- Restrict memory to 32 MB to reduce cache effects (append="mem=32" to lilo.conf)
- Swap off swap to prohibit swapping during measurements
- Sync for sure using umount instead of sync (look for clsync in the code)
- Cache flushes due to using umount between different parts of the measurement
- Add of a random read test where randomly chosen files are sequentially read
Test System
The hardware is the same as above.
- AMD Duron 650 Mhz, 128 MB, 40 GB EIDE-harddisk for the system with the tests taken on
- Adaptec AHA-2940U2/W host adapter
- 9 GB IBM DNES-309170W SCSI-harddisk
- Software: SuSE 7.2 (gcc 2.95-3) kernel 2.4.8-ac1 restricted to 32 MB memory without swap.
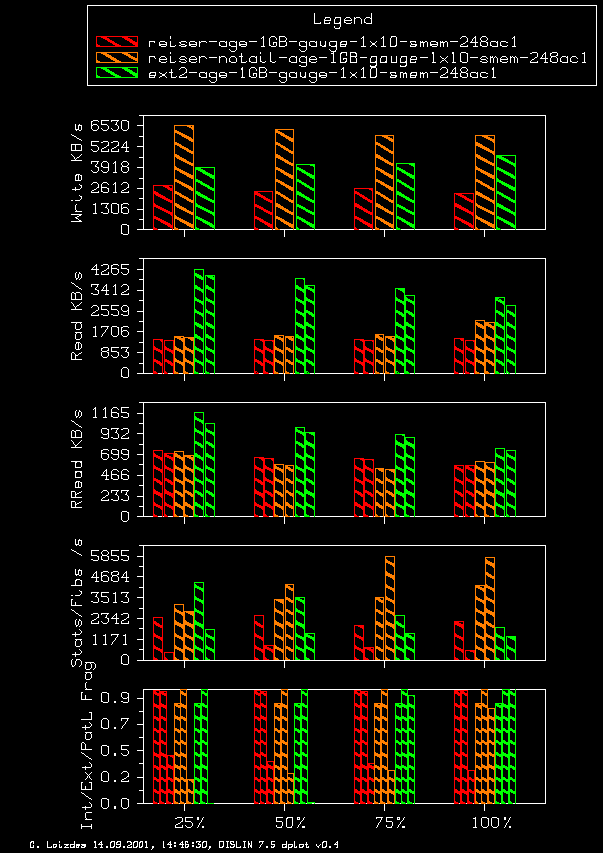
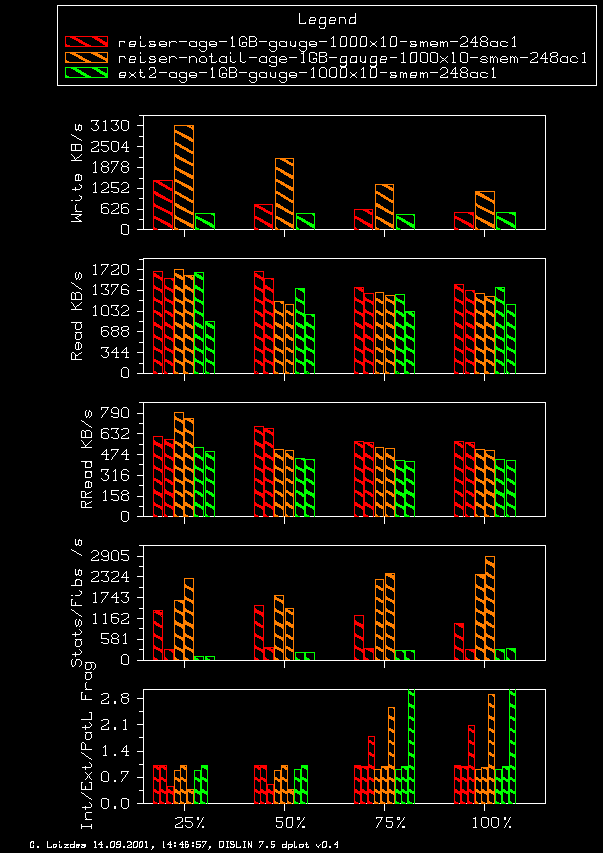
Graphical Output Explanation
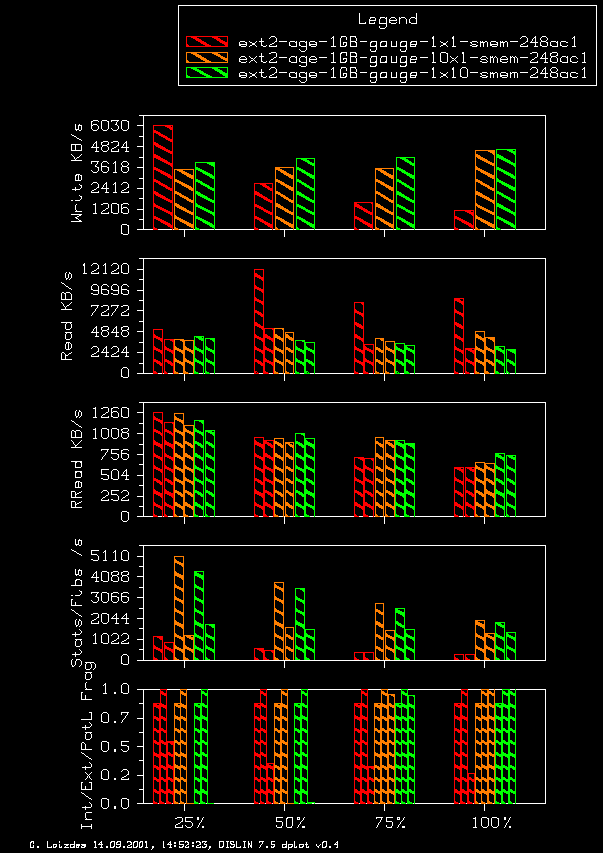
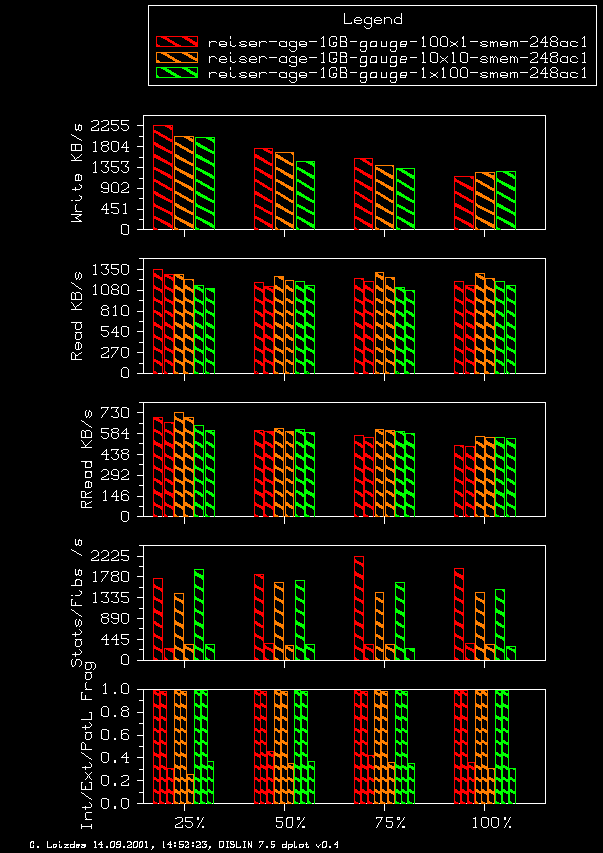
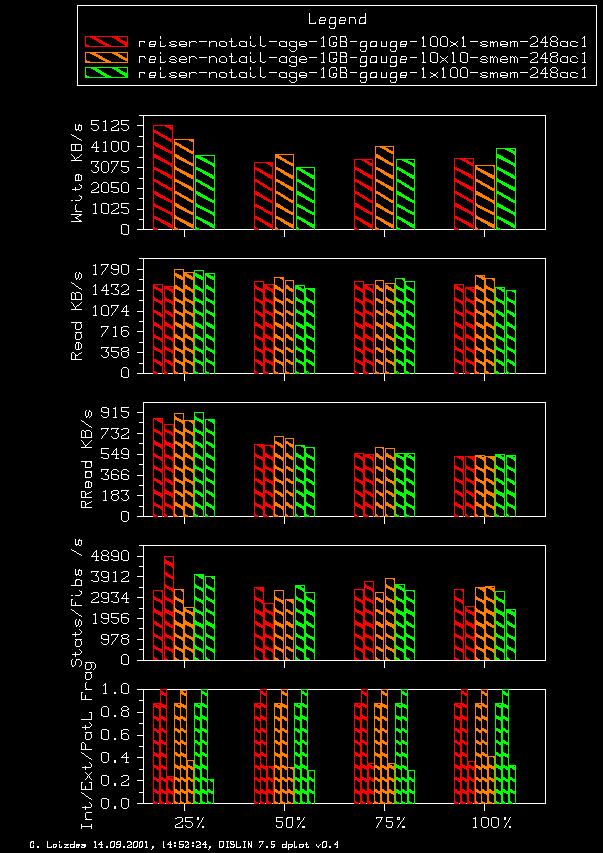
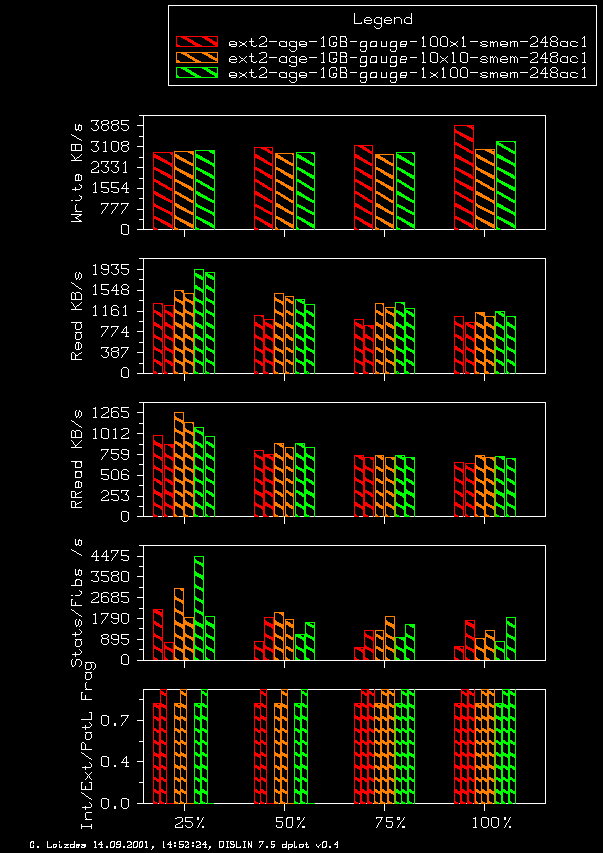
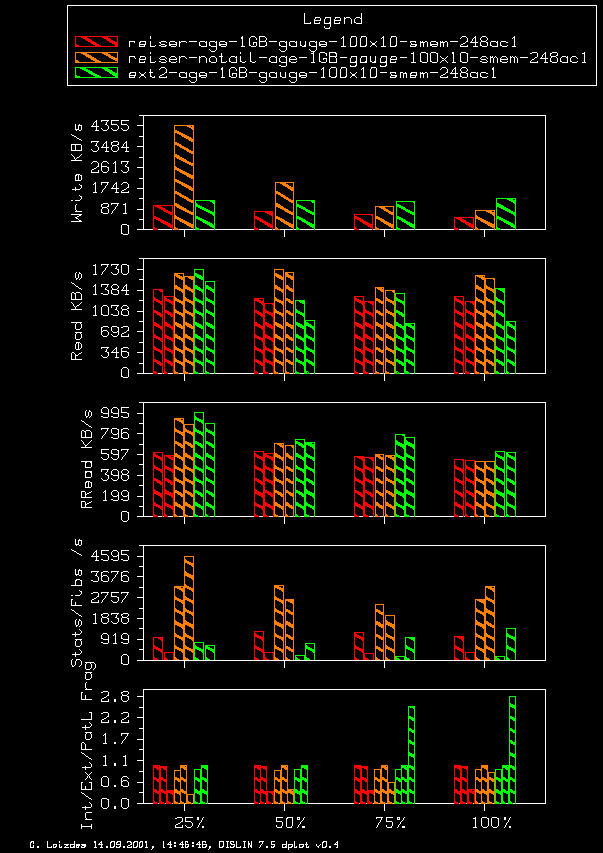
The shown graphical output differs slightly from above. It is again divided in 6 parts and reads as follows:- The first part consists of the legend and some remarks describing the graph as a total.
- The second part shows the absolute write performance in KB per second from the agesystem output file for 25%, 50%, 75% and 100% usage.
- The third part shows the read result for the different usage size. For each file system and usage you see two small bars. The first is the absolute read performance in KB per second measured with the timer starting just before the read system call and stopping right after it while recursively walking through all files in all directories. The second small bar should be lower than the first. It includes the time needed to traverse all files in all directories plus reading them eg. the timer is started before all file reads and stopped after the last file is read. At best for a read test the bars should not differ too much with the second bar smaller than the first.
- The fourth part measures the random read performance when the files are randomly chosen and then sequentially read. The first run of read stores the file names and paths in memory, so that this time no stat or readdir overhead is needed. Again there are the two columns for the random read performance which should now be ''more equal'' because there is a smaller difference between the total accumulated read time and the total running time of the random read test than when recursively walking through the directories stating each file.
- The fifth part shows some meta data performance. The first small bar is the number of files stated (and read) during the recursive walk of read divided by the time difference mentioned above, eg. total run time of read minus accumulated read time of read which mainly is the time needed to open and read the directories plus stating the files in them. The second bar is the number of files found while fibmap recursively walks through all directories stating (and fibmaping) all files but not reading them divided by its running time. Again, the two bars should be of the same order in magnitude with the second less high than the first. At least I thought that before the measurements...
- The sixth part shows the internal fragmentation (first small bar) and the external fragmentation (second small bar) and the fragmentation path results (third small bar) reported by fibmap. If the maximum frag path shown is greater than one (its minimum value) the log of it is plotted which is marked on the left (it says: ''PatL'' instead of ''Path'').
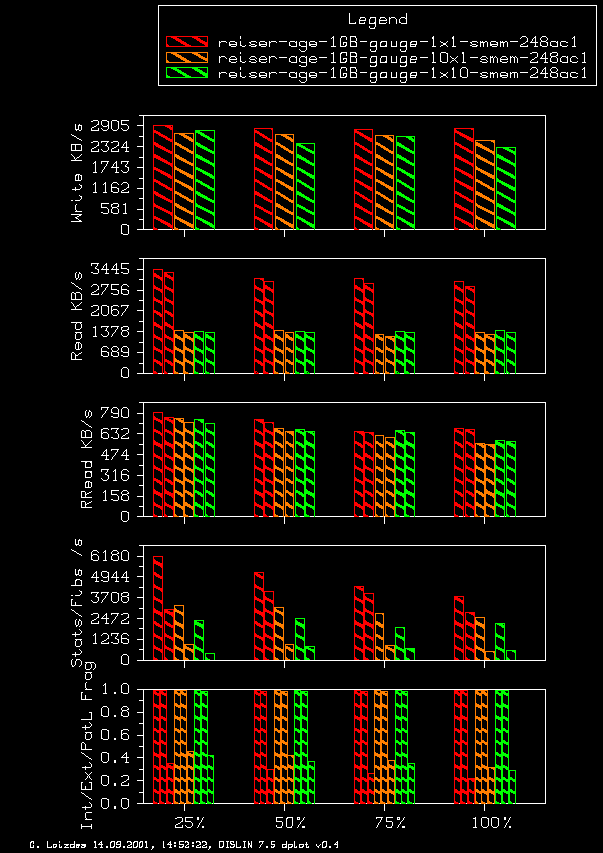
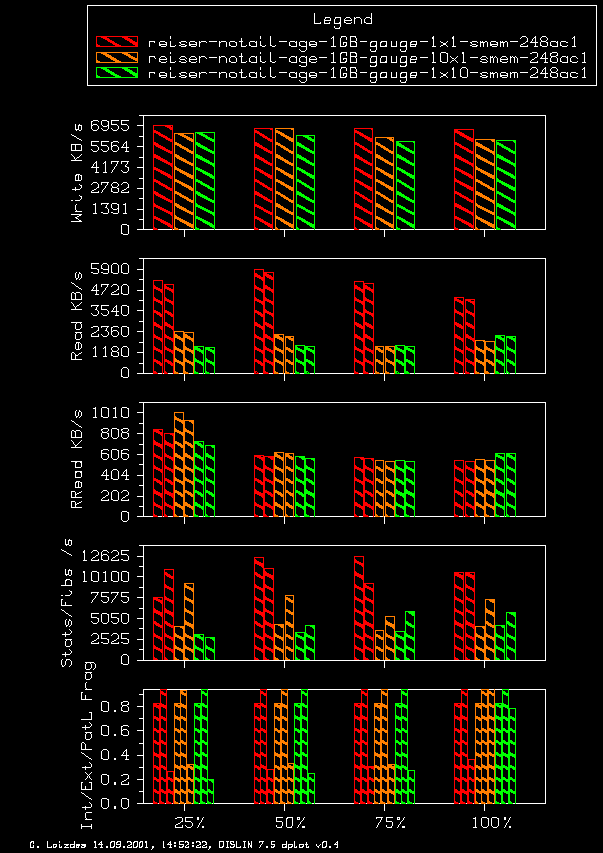
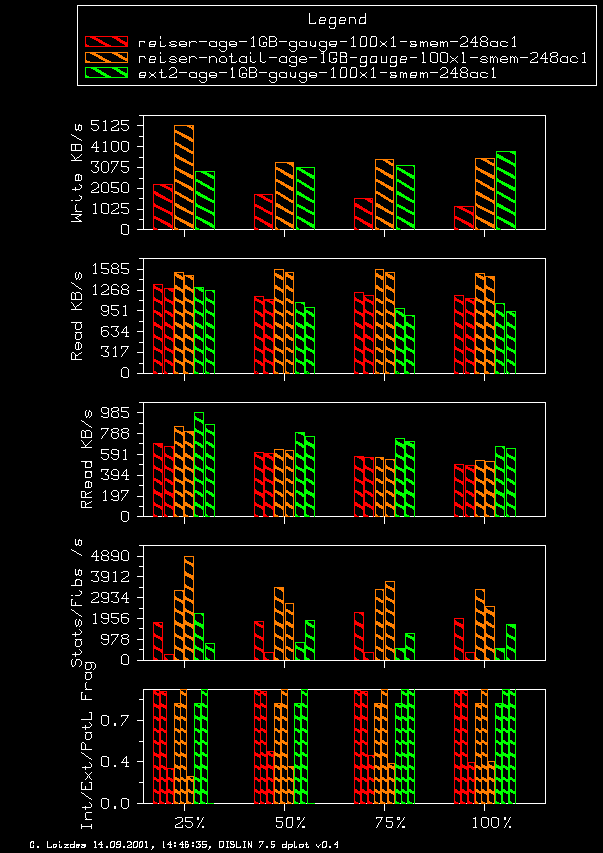
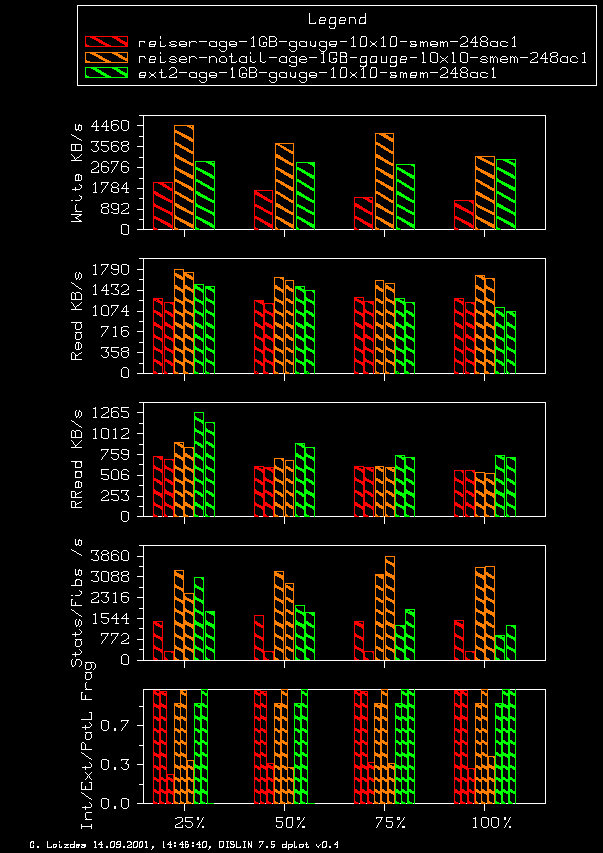
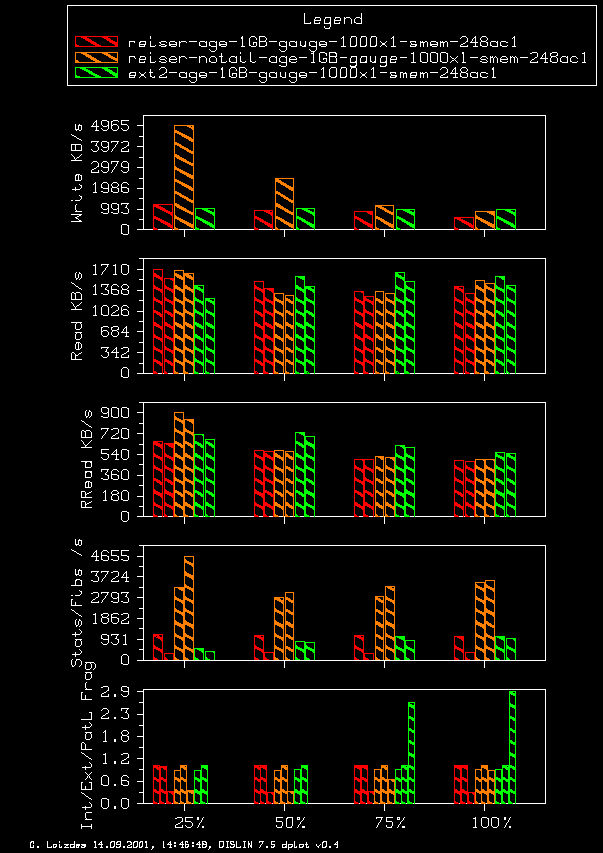
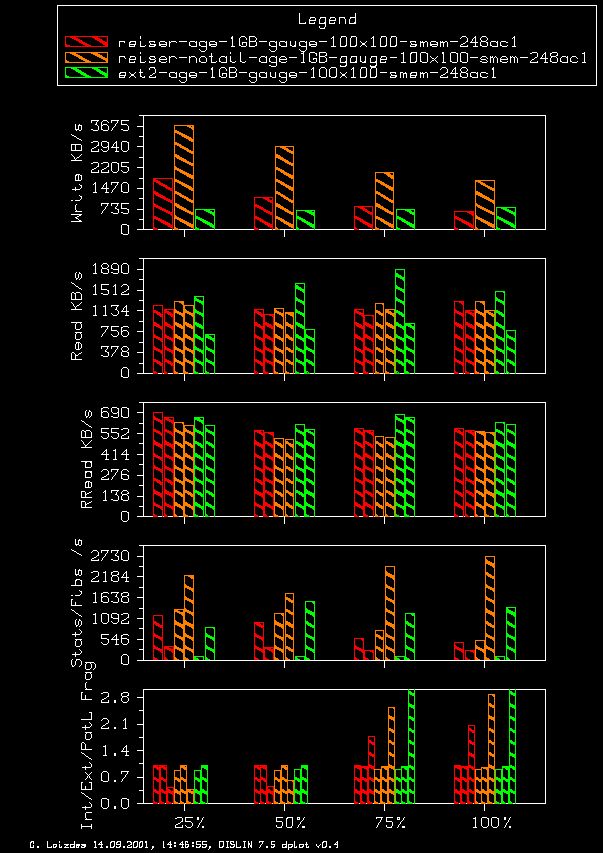
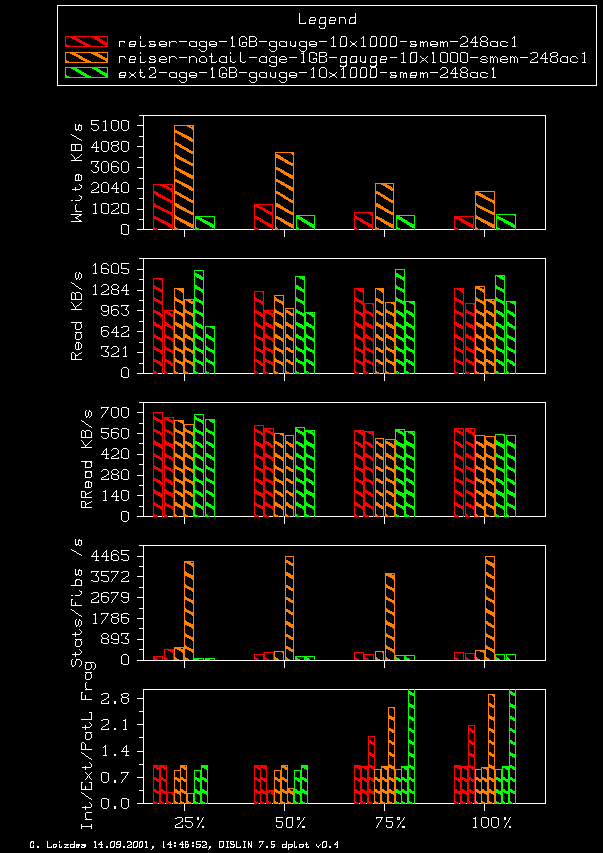
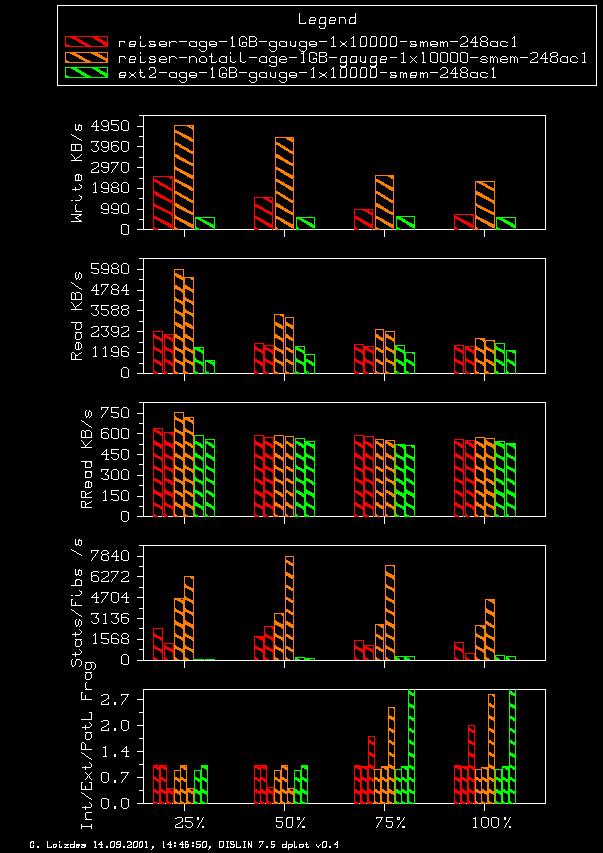
Variable File Size Results for different directory structures
To test the directory structure dependence, I used the following setup:- Partition Size: 1 GB
- File systems: Reiser, Reiser with -o notail and Ext2
- File size distribution: as in the agesystem section
- Directory structures:
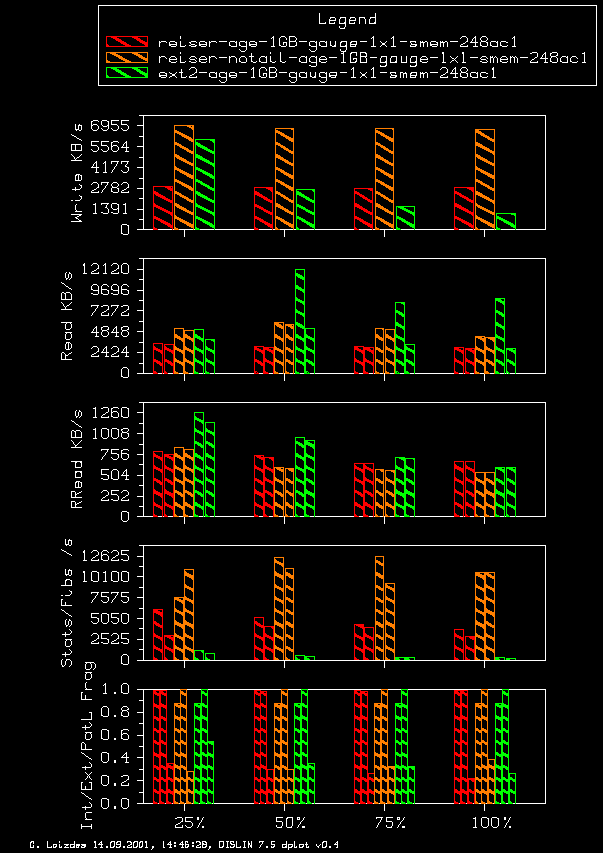
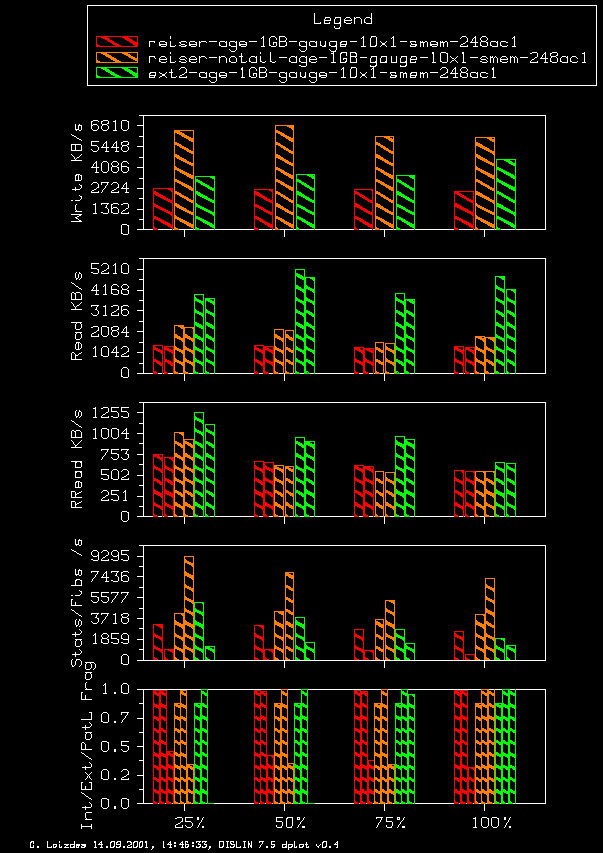
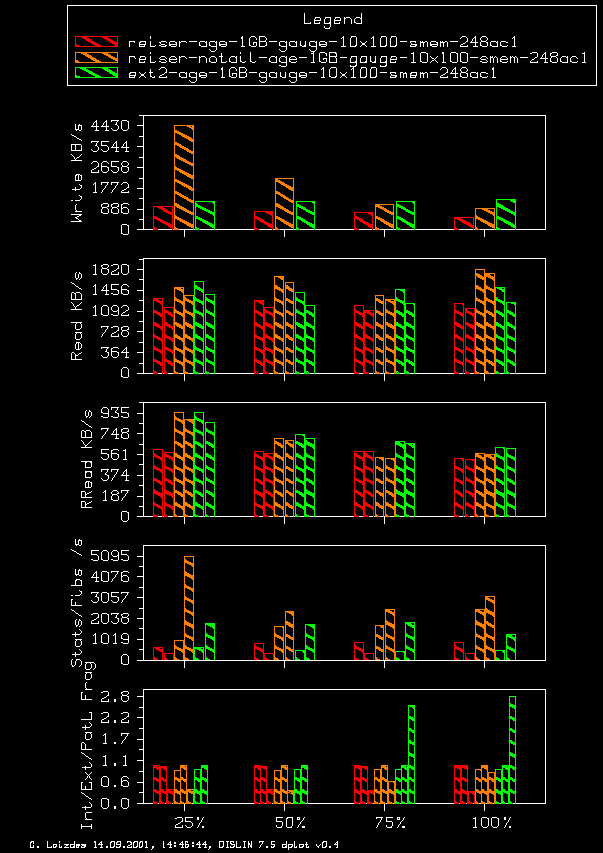
1x1, 10x1, 1x10 (referred to 10 in total);
100x1 10x10 1x100 (referred to 100 in total);
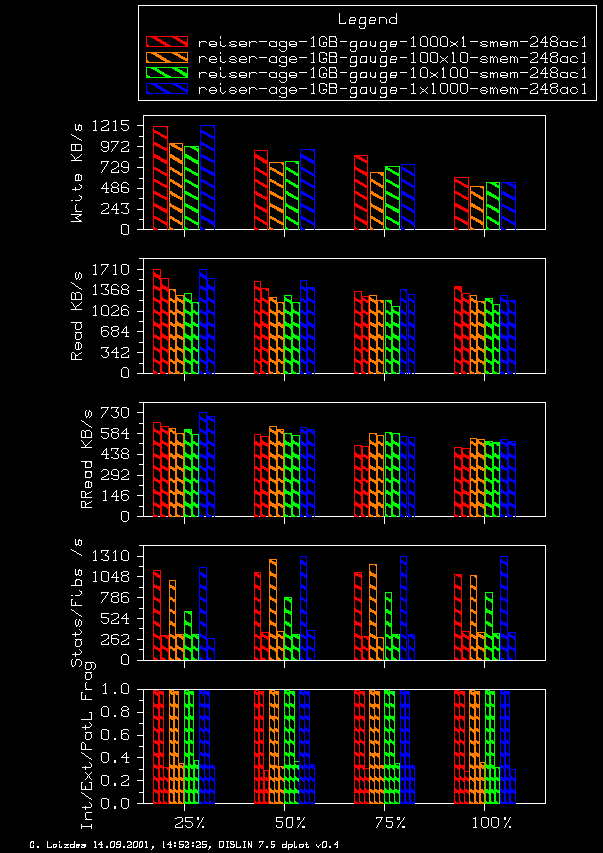
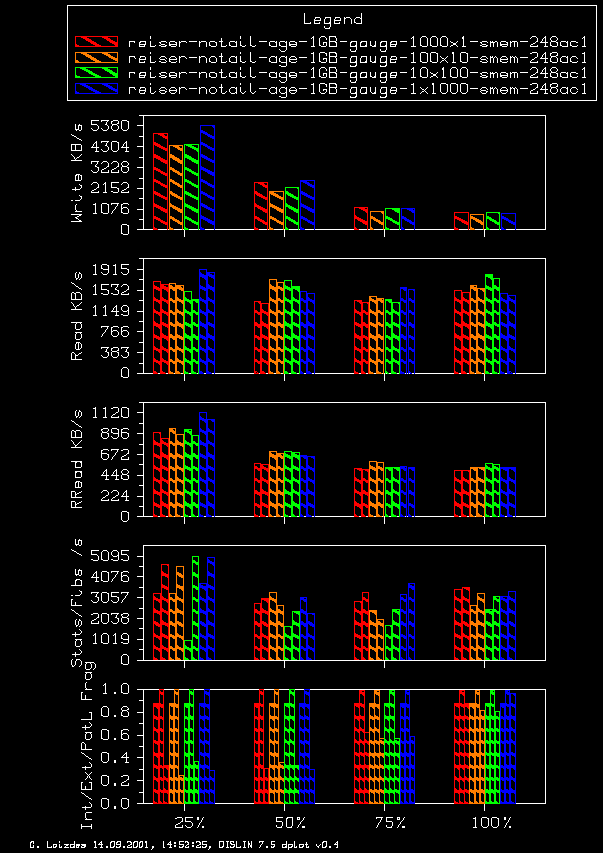
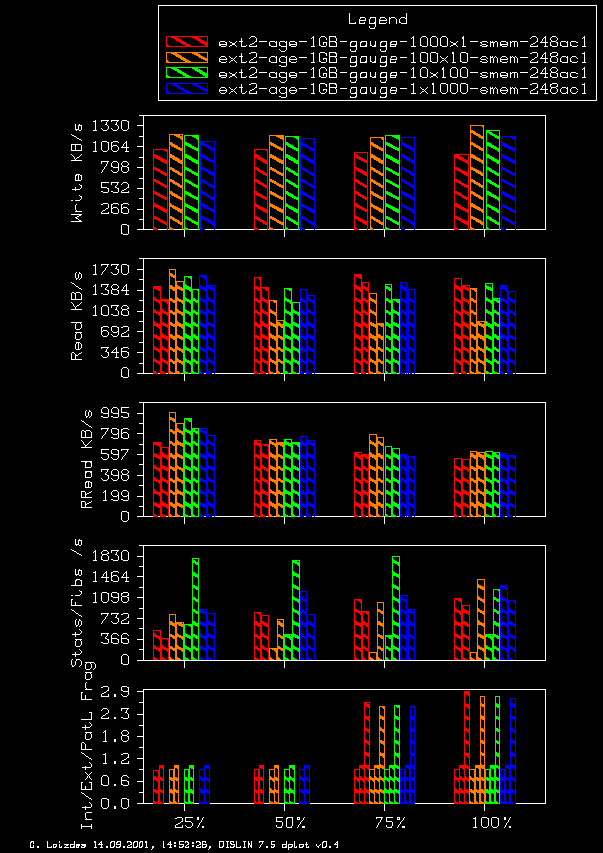
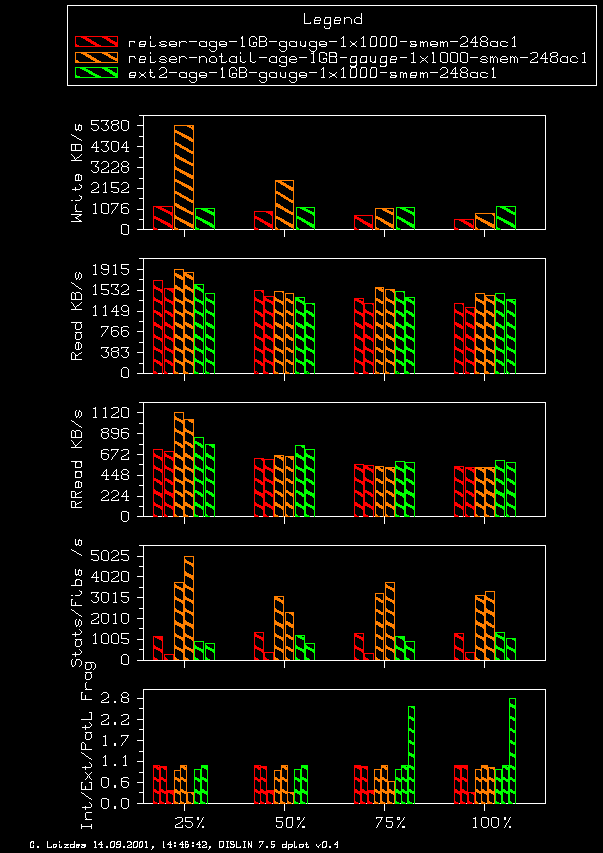
1000x1, 100x10, 10x100, 1x1000 (referred to 1000 in total)
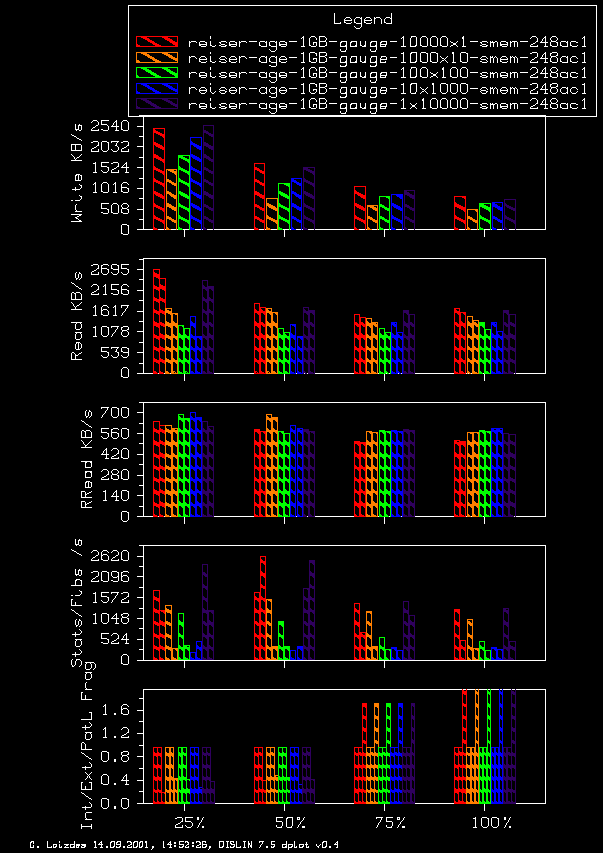
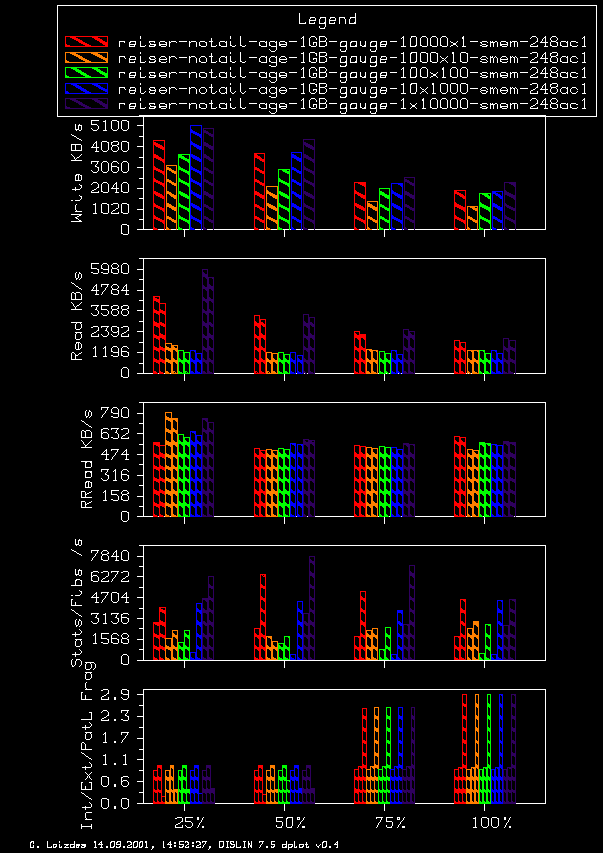
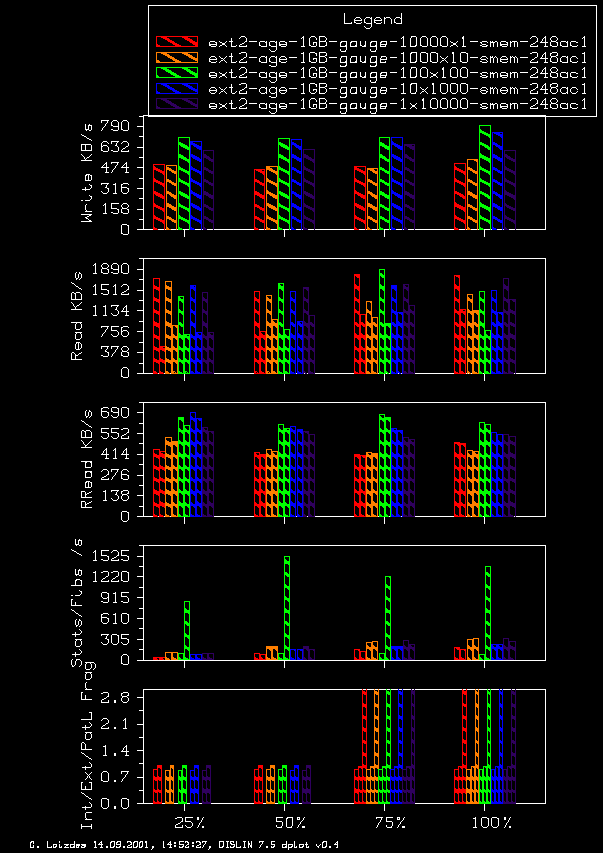
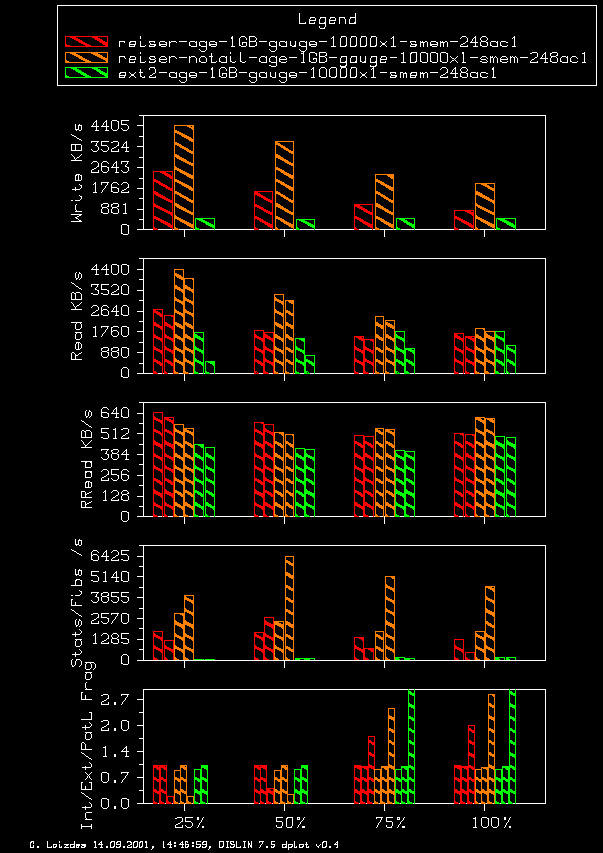
10000x1, 1000x10, 100x100, 10x1000, 1x10000 (referred to 10000 in total)
- The write performance is influenced by two factors:
The first is intrinsic to the file system: the costs to handle a certain number of files per directory.
The second is determined by the way agesystem chooses the directories to work at: it proceeds from directory to directory in a defined way, writing in each directory only one file. That is the dcache determines a certain amount of the write performance. A test to demonstrate this could be to write a certain amount of files to one directory at once before proceeding to the next directory.
Both effects are enhanced by the file size distribution, which in the tested cases strongly peaks for small files. - The read performance shows the same Dependance. In some cases mainly for ext2 one can see also the effect of having to handle a big number of files per directory (the two bars differ!).
- As a major difference the random read performance saturates for all setups which is due to expensive disc seeking times which mainly determine the performance for the chosen small file size distribution.
| Reiser | Reiser -o notail | Ext2 | Comments |
|---|---|---|---|
| 10 ReiserFS Breakdown in read performance between 1x1 and 10x1 (resp. 1x10)! Why that big difference? |
10 ReiserFS notail Breakdown in read performance between 1x1 and 10x1 (resp. 1x10)! Why that big difference? |
10 Ext2 Clearly seen the overhead of maintaining many files per directory. Bad stating performance. |
Overall best case for Reiser: many small files per directory. |
| 100 ReiserFS | 100 ReiserFS notail | 100 Ext2 | This is a case where the directory structure shows no relevance. |
| 1000 ReiserFS | 1000 ReiserFS notail Write performance becomes bad after very good start and is even significantly worse than for 10000 directories. |
1000 Ext2 It looks like that between 100 and 1000 entries can be cached: 100x10 und 10x100 are slightly better for writing and random read and worse for recursive walkings because the directory commands become expensive. |
Directory structure shows up for Ext2. |
| 10000 ReiserFS The 1x10000 and 10000x1 are faster for read, but slower for random read. |
10000 ReiserFS notail Seems, that the extreme 1x10000 and 10000x1 are better than the moderate structures. |
10000 Ext2 Again, the moderate structures are in favour for writing and random read. 1x10000 and also 10000x1 are better for recursive operations. |
Directory structure shows up for Ext2 and slightly less for Reiser. |
1x1 10x1 1x10
100x1 10x10 1x100
1000x1 100x10 10x100 1x1000
10000x1 1000x10 100x100 10x1000 1x10000