|
|
|
|
|
Introduction Definition of Terms internal-fragmentation external-fragmentation standard formulation fragmentationX fragmented path Link to my old page Copyright and Contact |
|
|
|
Description download |
|
|
|
Description download |
|
|
|
|
|
|
|
|
|
Description download |
|
|
|
Description download Measurements on 2.4.8 Measurements on 2.4.10 |
|
|
|
Filesystem Homepages ReiserFS Ext2FS Ext3FS XFS JFS Benchmarks & Results ReiserFS benchs Denis'+Kresimir's site Randy's tests Yves' YAFB tests Literature Smith's site My master thesis |
|
|
Last changes:
Do Feb  5 09:40:02 CET 2004
|
|
Description
The following bunch of tests tries to measure a worst case setup for every file system. On a given partition I chose to create a certain number of files in a certain directory structure (the -n and -c option of agesystem. A fixed or variable number (according to a given distribution) of bytes is appended to each files in a row so that the files continuously grow in size. When reaching a certain percentage of used blocks of the partition, the partition is copied on to a similar but freshly created partition of the same partition size. Then the known tests of the gauge section are being run on both partitions. In that way I want to compare the performance of the first (fragmented) partition to the second (non fragmented).In Detail:
- Choose a set of file systems to test (eg. reiser, reiser -o notail and ext2)
- Choose the directory structure for agesystem (eg. 1x1)
- Choose the file size distribution for agesystem (eg. the standard for a 1 GB partition) or choose a fixed size (-f and -b option for fixed size) to append (-o option)
- Loop over the file systems to test
- Format partition one to append on
- Loop over the -u option (usage) of 25, 50, 75 and 99 percent for agesystem
- Run agesystem with the set of chosen options
- Format partition two and copy partition one onto it (cp -R . /partition2)
- Run fibmap to get the written block layout on both partitions
- Run read to measure the read performance on both partitions
Download
You may download the necessary files and try it yourself. After downloading the package create a directory where to untargz it. You probably need to adjust some paths, then type ''make agesystem; make fibmap; make read'' and look for the script ''apptest.sh'' that shows how to setup the options described above. If you like to get some graphs out of the resulting output, send the output files to me (targzed, please!).
Measurements on 2.4.8-ac1
Test System
The hardware and settings are the same as in the gauge section.
- AMD Duron 650 Mhz, 128 MB, 40 GB EIDE-harddisk for the system with the tests taken on
- Adaptec AHA-2940U2/W host adapter
- 9 GB IBM DNES-309170W SCSI-harddisk
- Software: SuSE 7.2 (gcc 2.95-3) kernel 2.4.8-ac1 restricted to 32 MB memory without swap.
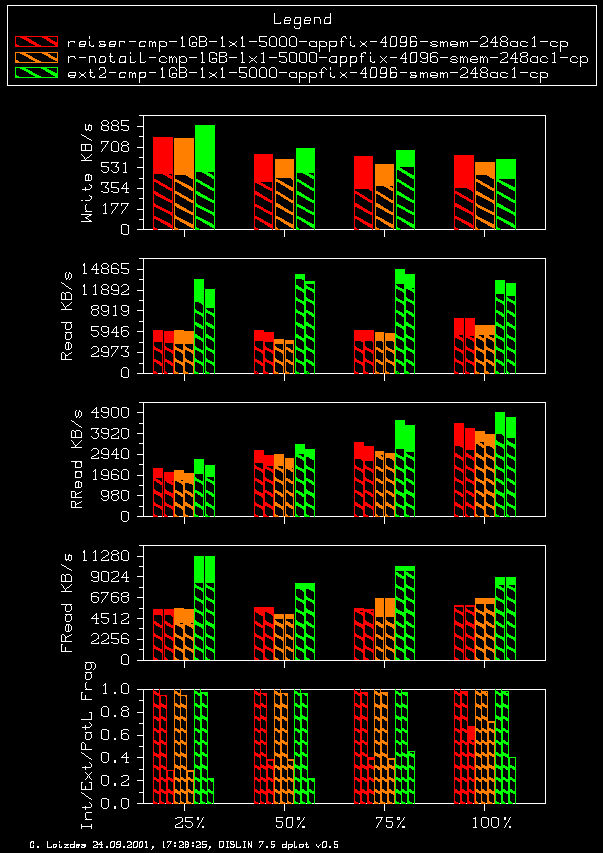
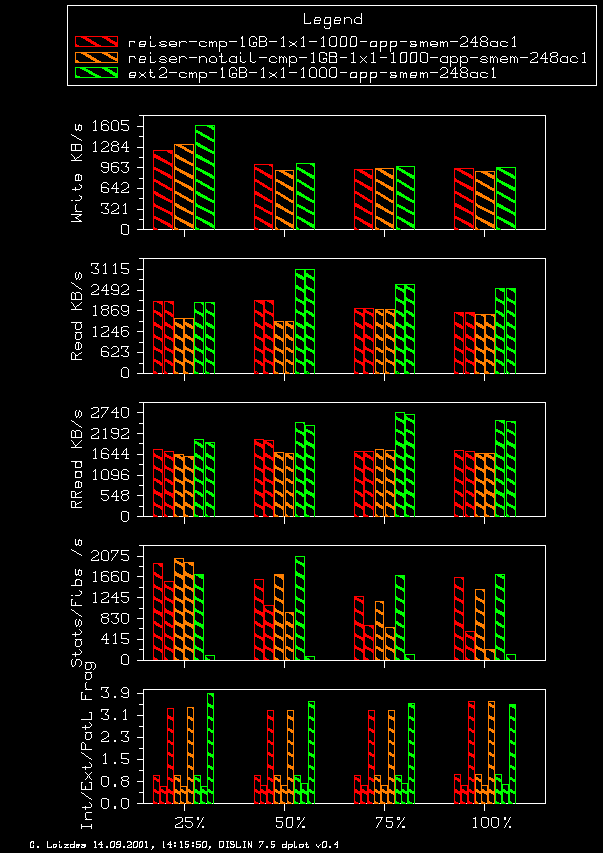
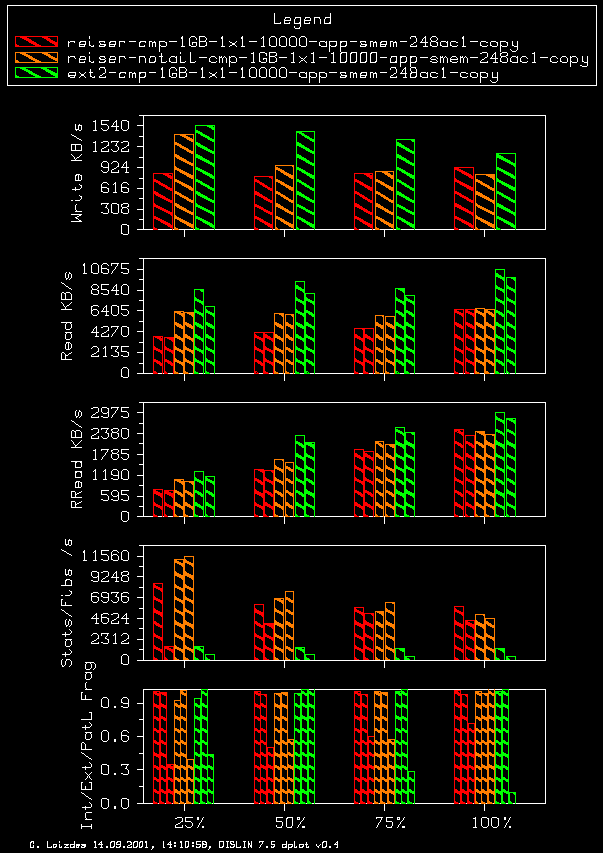
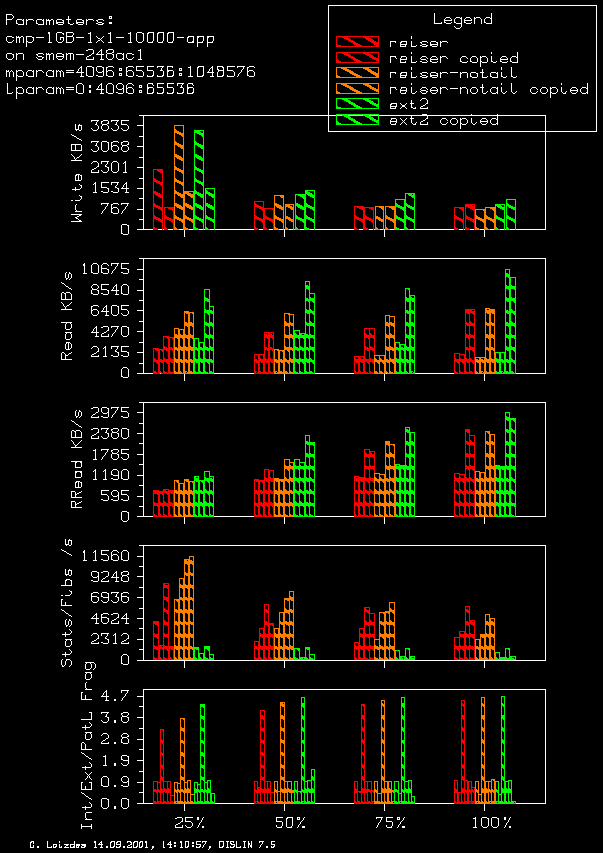
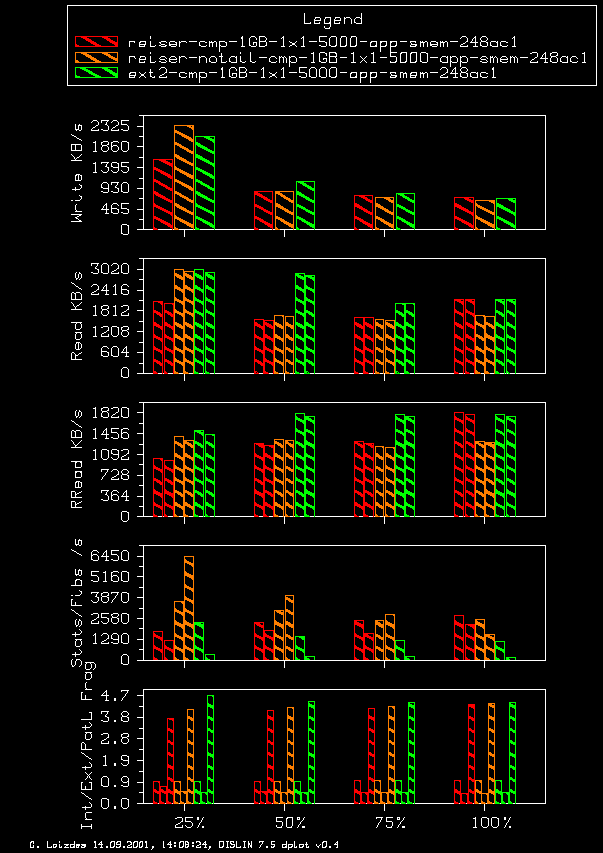
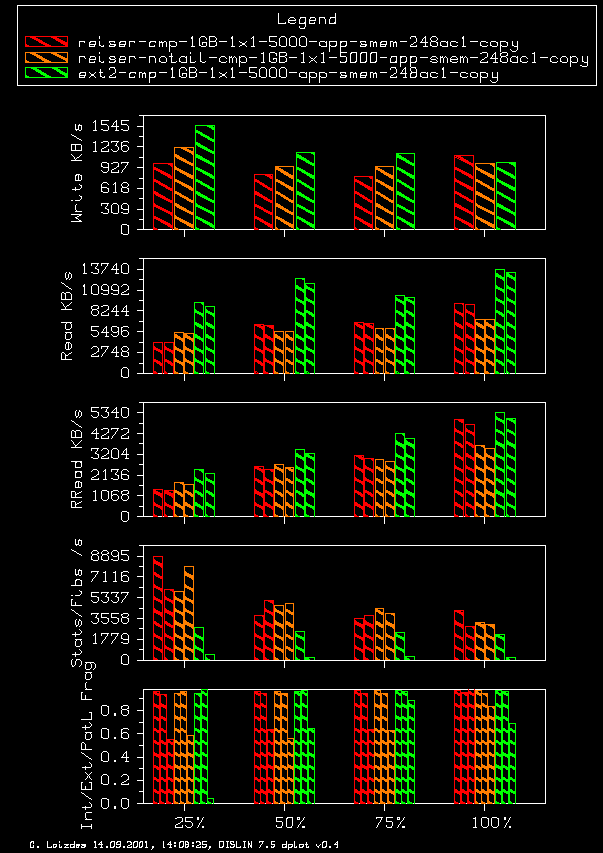
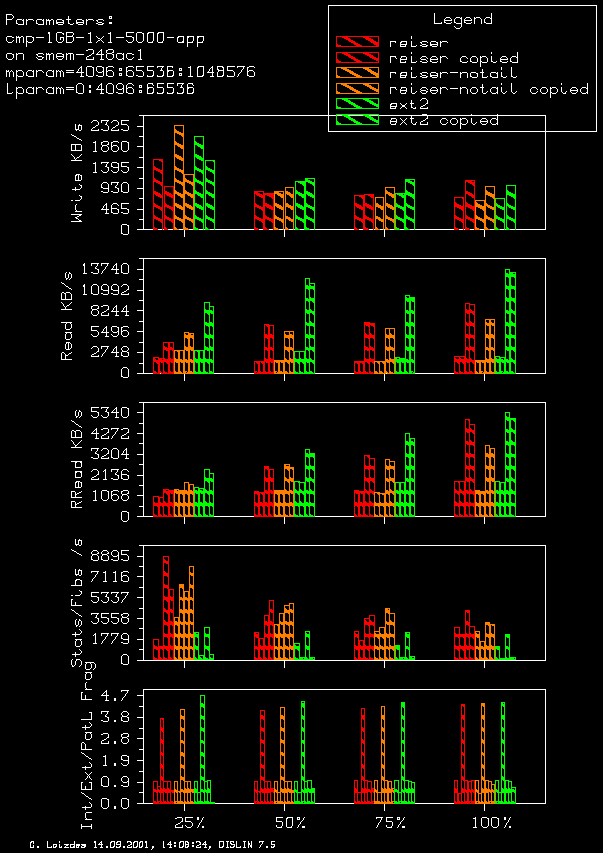
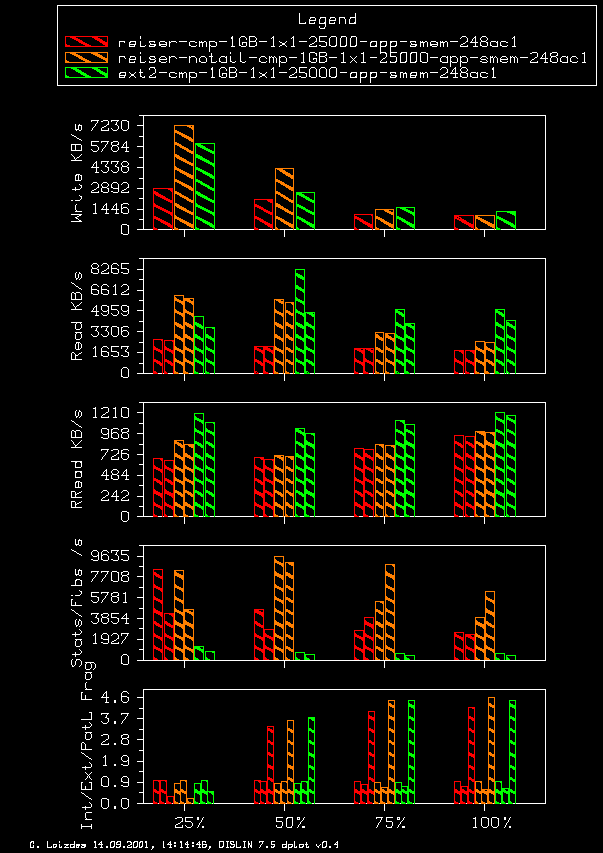
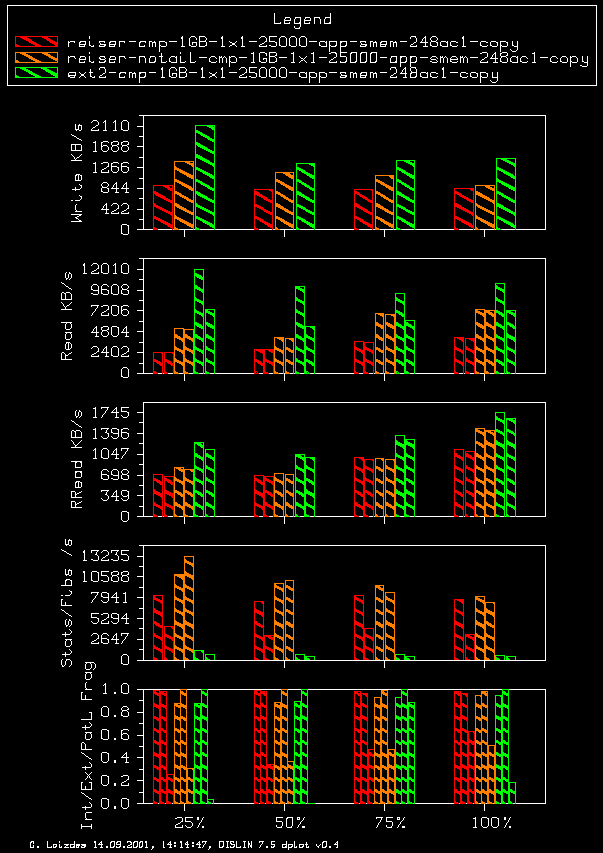
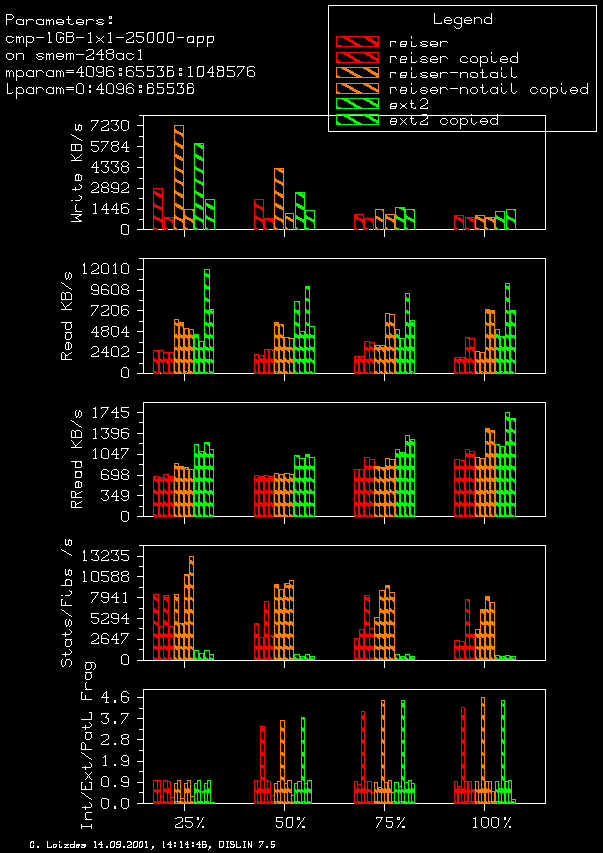
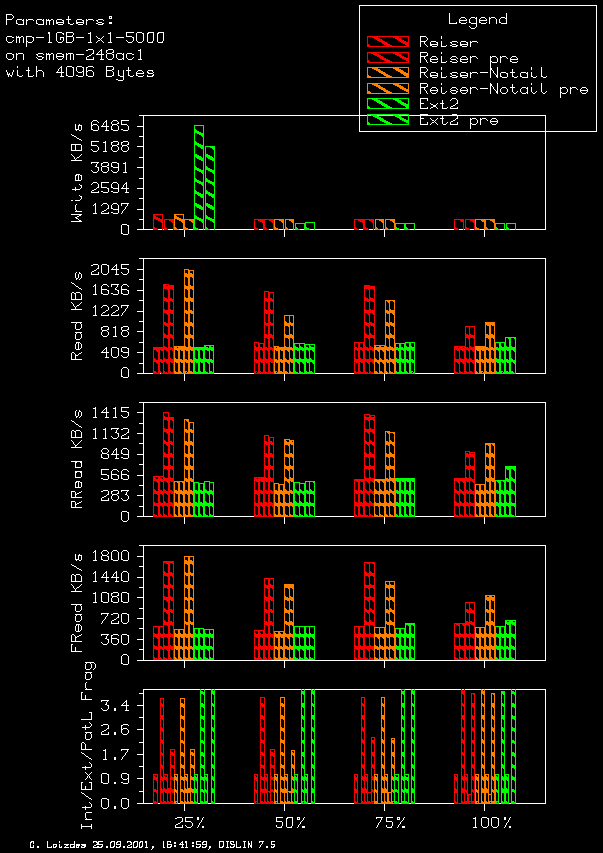
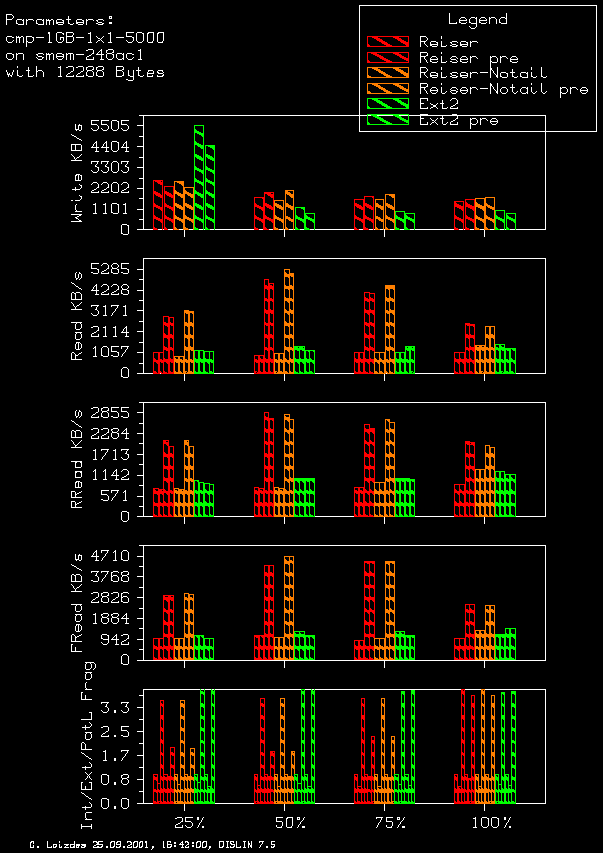
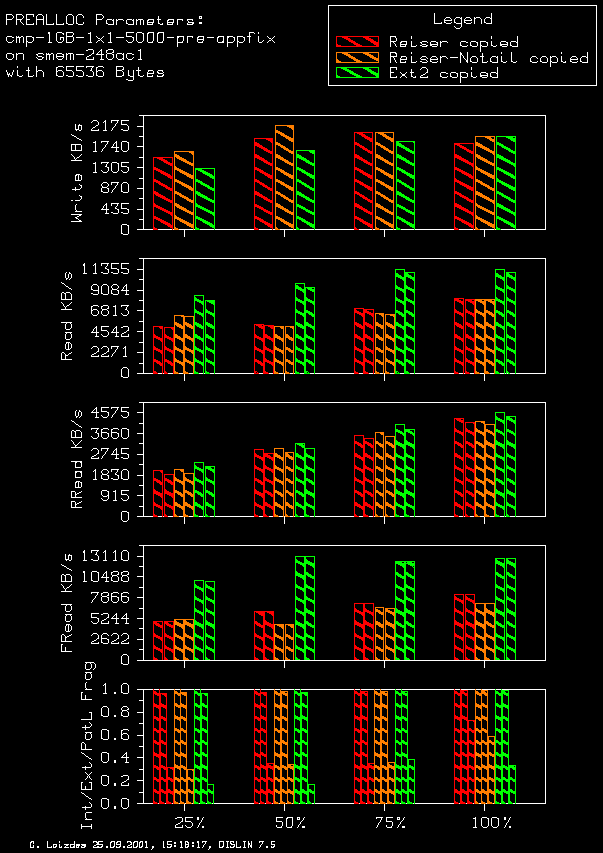
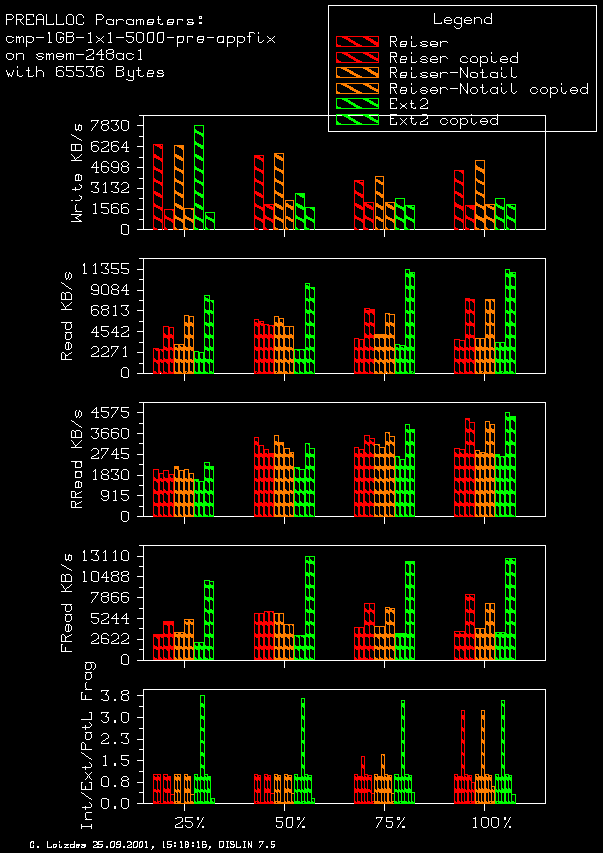
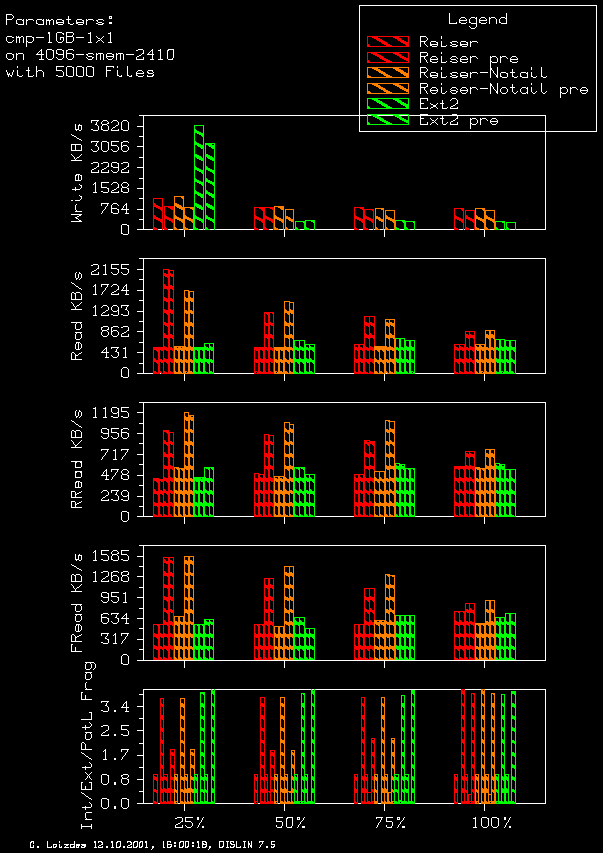
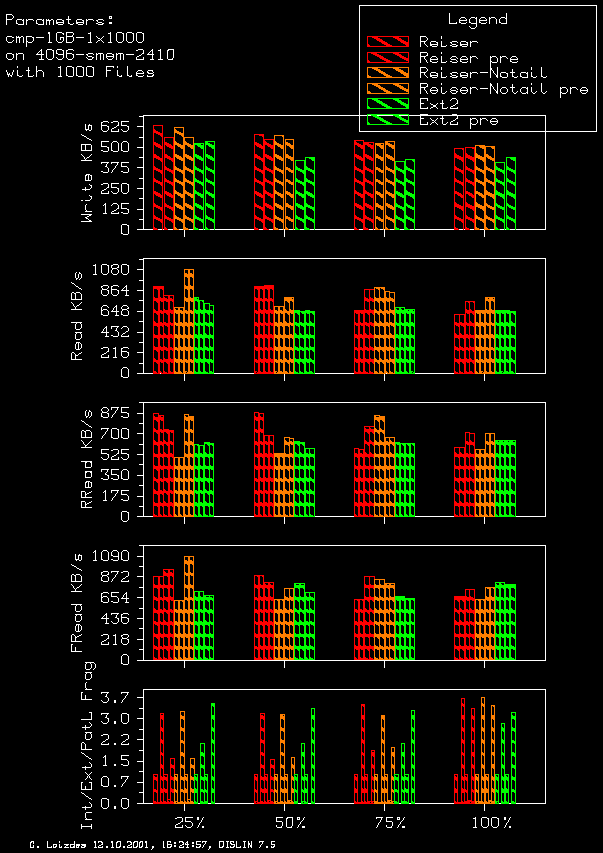
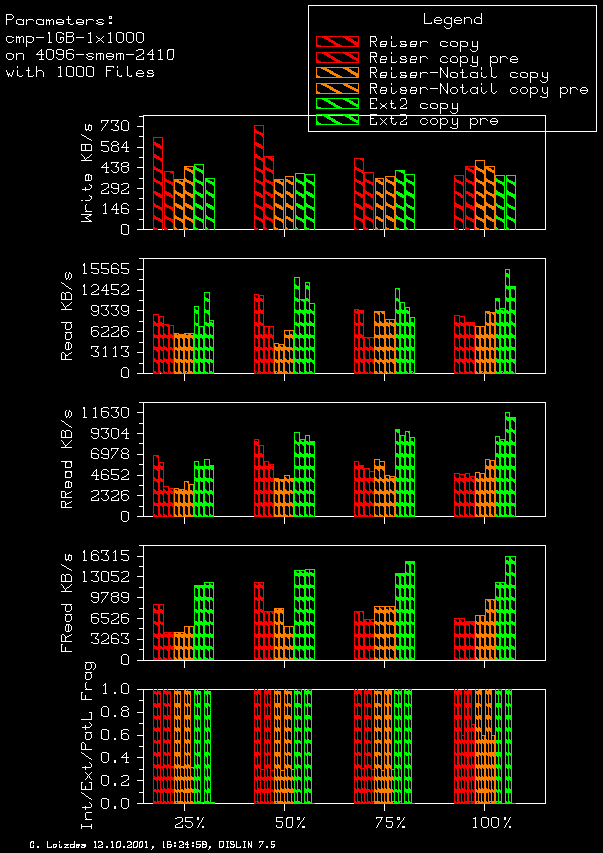
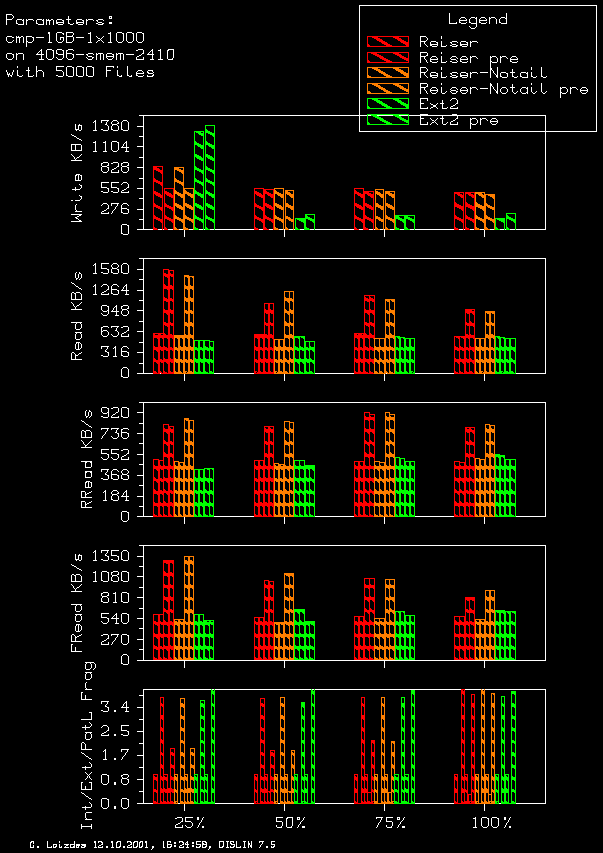
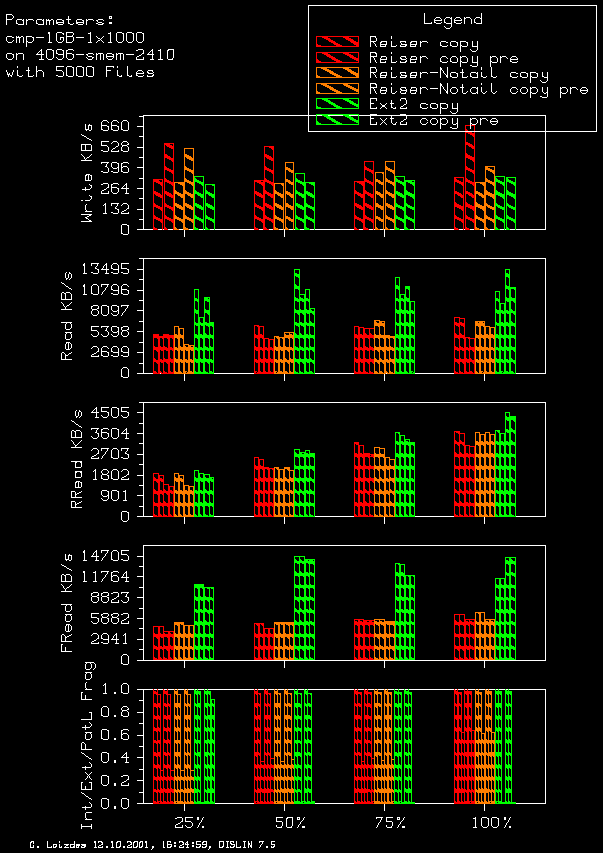
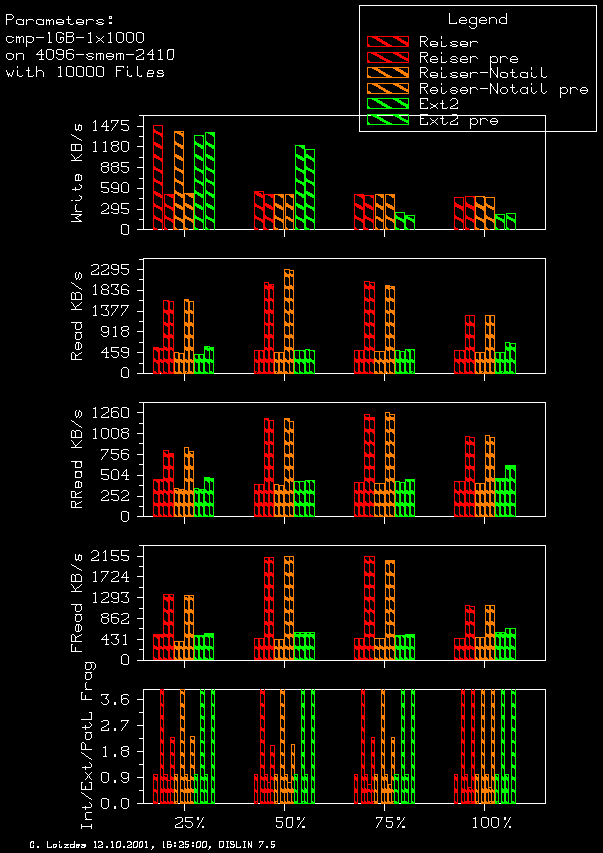
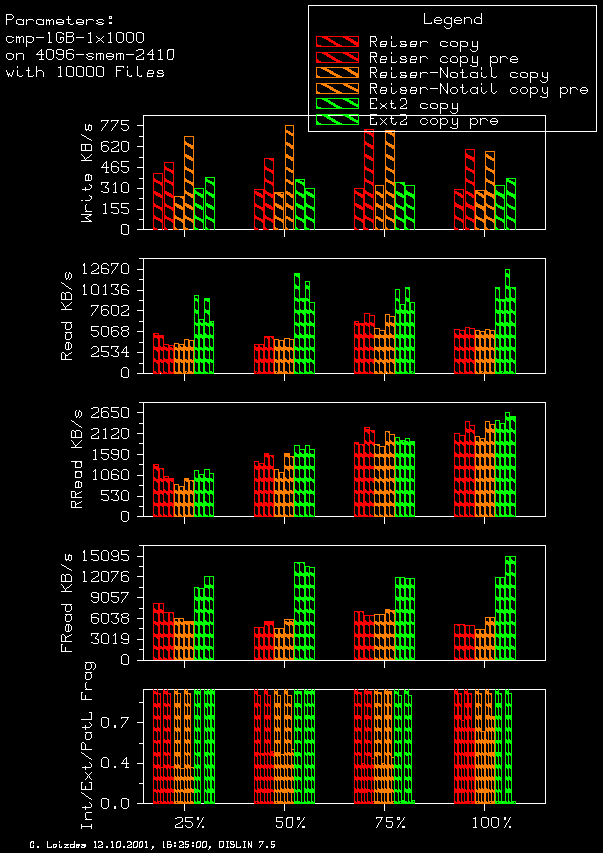
Graphical Output Explanation
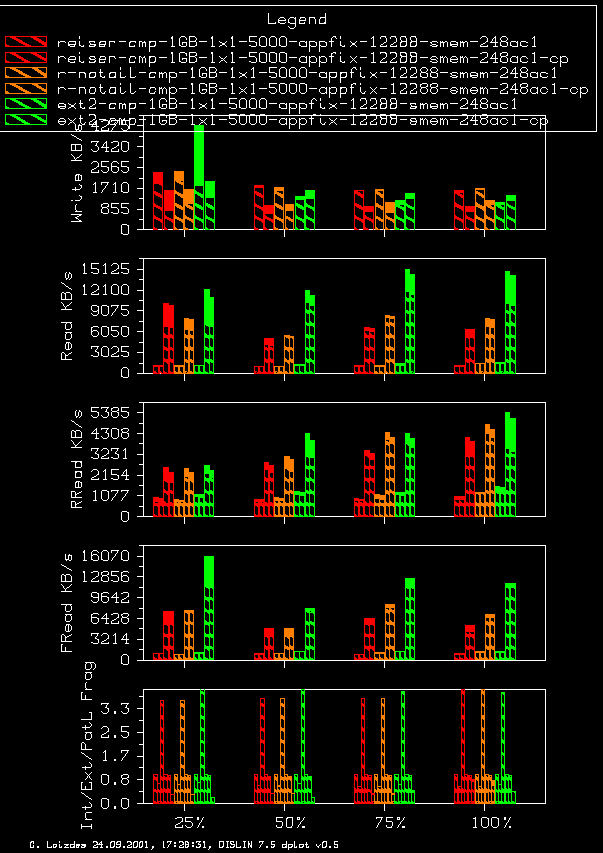
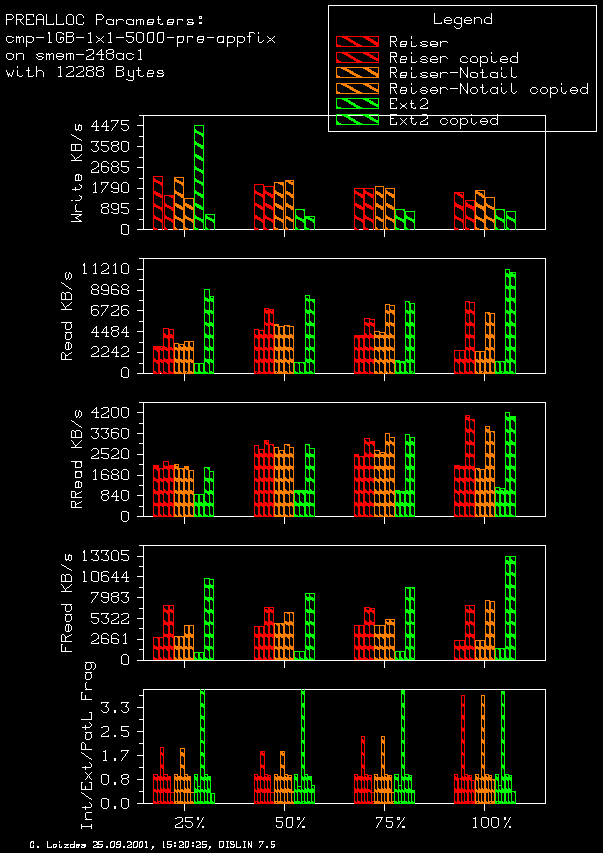
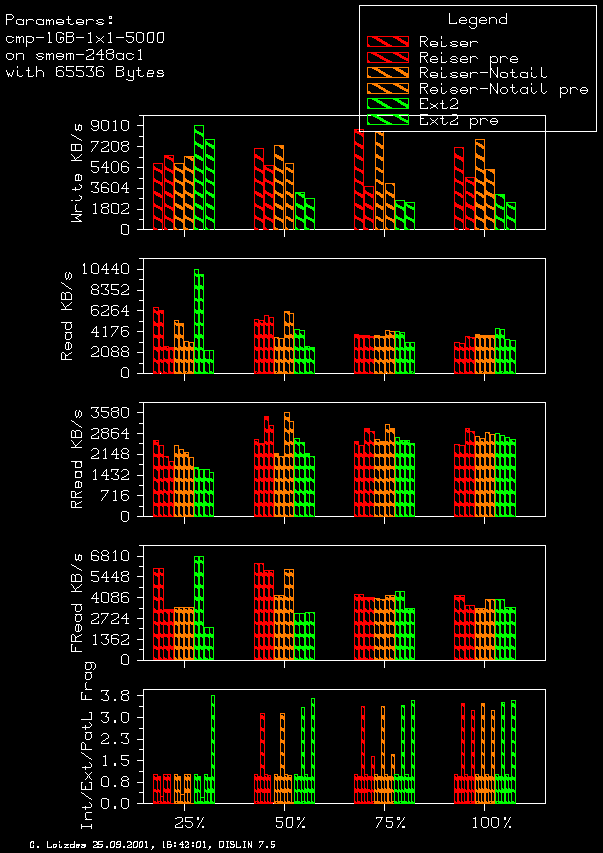
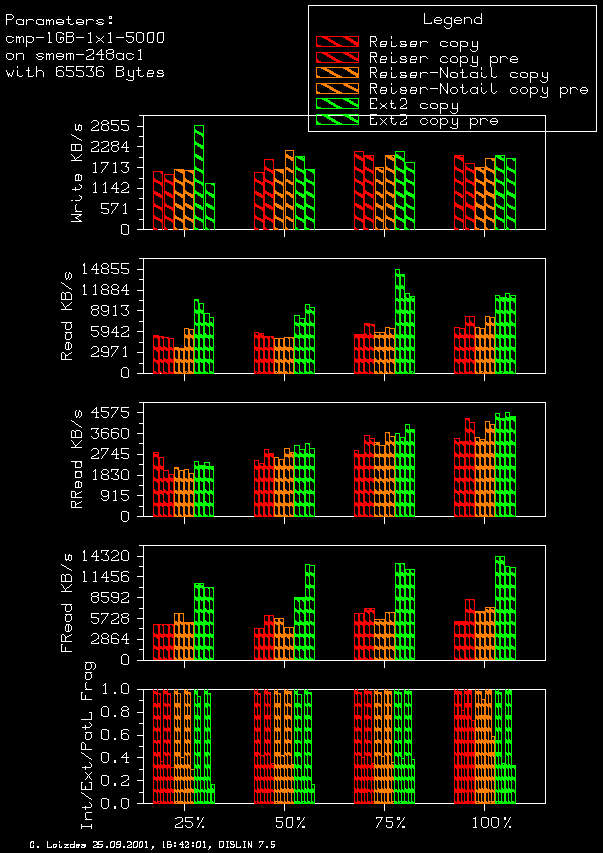
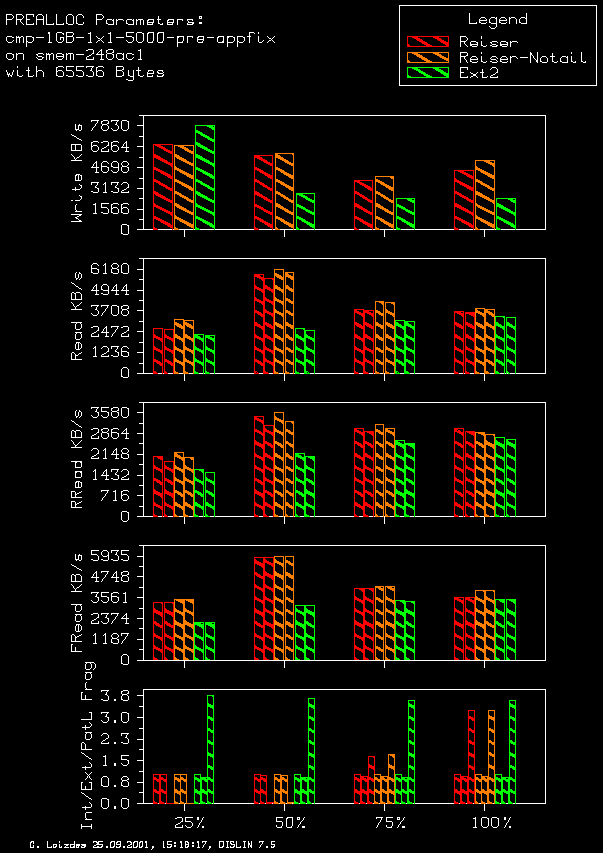
The shown graphical output is devided in 6 parts and reads as follows:- The first part consists of the legend and some remarks describing the graph as a total.
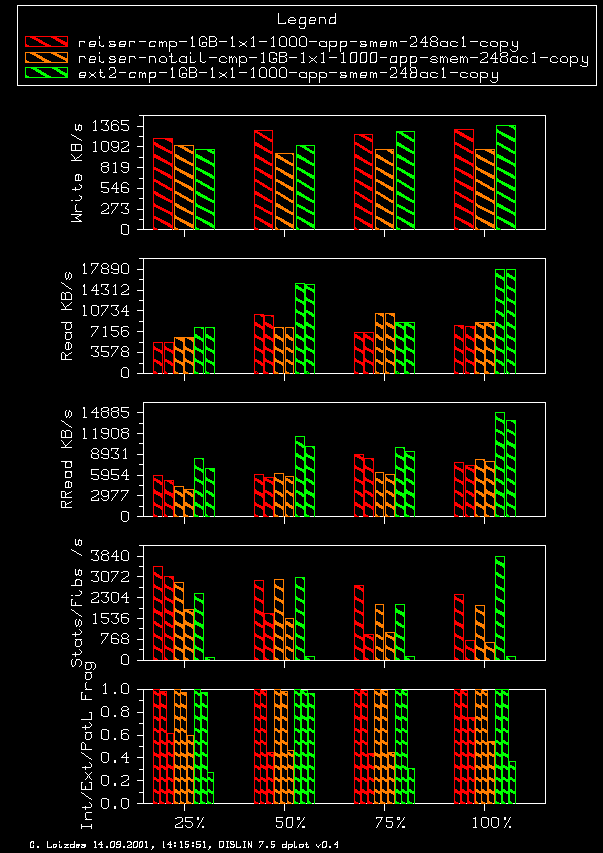
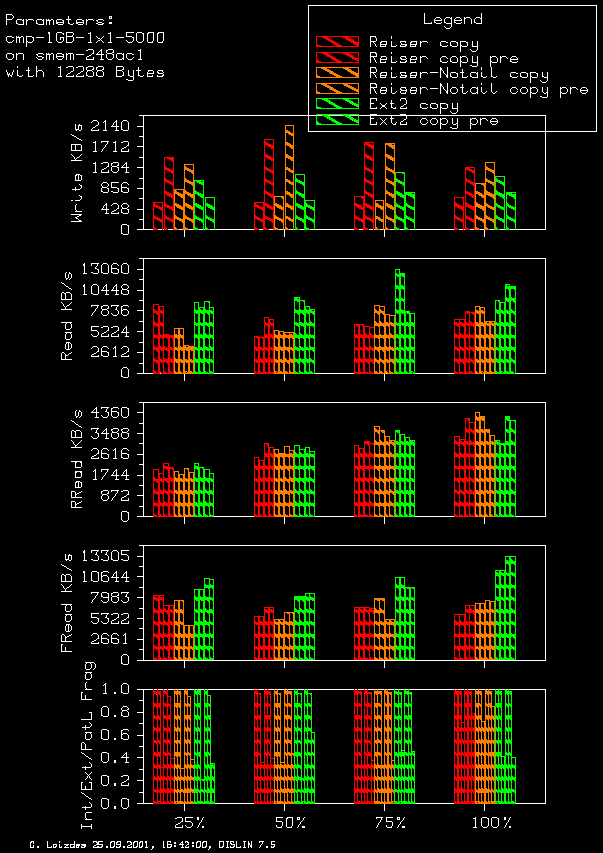
- The second part shows the absolute write performance in KB per second from the agesystem output file for 25%, 50%, 75% and 100% usage. When the partition is copied --usually there is a remark ''-copy'' somewhere in the legend-- the shown performance is the total number of bytes copied devided by the total runtime of the ''cp -R . /partition2''. Keep that difference in mind comparing the two numbers, when both are shown in the same graphs.
- The third part shows the read result for the different usage size. For each file system and usage you see two small bars. The first is the absolute read performance in KB per second measured with the timer starting just before the read system call and stopping right after it while recursively walking through all files in all directories. The second small bar should be lower than the first. It includes the time needed to traverse all files in all directories plus reading them eg. the timer is started before all file reads and stopped after the last file is read. At best for a read test the bars should not differ too much with the second bar smaller than the first.
- The fourth part measures the random read performance when the files are randomly chosen and then sequentially read. The first run of read stores the file names and paths in memory, so that this time no stat or readdir overhead is needed. Again there are the two columns for the random read performance which should now be ''more equal'' because there is a smaller difference between the total accumulated read time and the total running time of the random read test than when recursively walking through the directories stating each file.
- The fifth part shows some meta data performance. The first small bar is the number of files stated (and read) during the recursive walk of read devided by the time difference mentioned above, eg. total run time of read minus accumulated read time of read which mainly is the time needed to open and read the directories plus stating the files in them. The second bar is the number of files found while fibmap recursively walks through all directories stating (and fibmaping) all files but not reading them devided by its running time. Again, the two bars should be of the same order in magnitude with the second less high than the first. At least I thought that before the measurements...
- The sixth part shows the internal fragmentation (first small bar) and the external fragmentation (second small bar) and the fragmentation path results (third small bar) reported by fibmap. If the maximum frag path shown is greater than one (its minimum value) the log of it is plotted which is marked on the left (it says: ''PatL'' instead of ''Path'').
- Read: The units of the first two values are KB per second, the third is the percentage.
- Random Read: The units of the first two values are KB per second, the third is the percentage.
- Write: Units are KB per second.
- Fragmentation: Absolute values for the first two rows, the third is the percentage. Except for frag path, in that case it is simply the ratio.
- Runtime: Total running time of writing (appending or copying) and the three tests. Units are seconds.
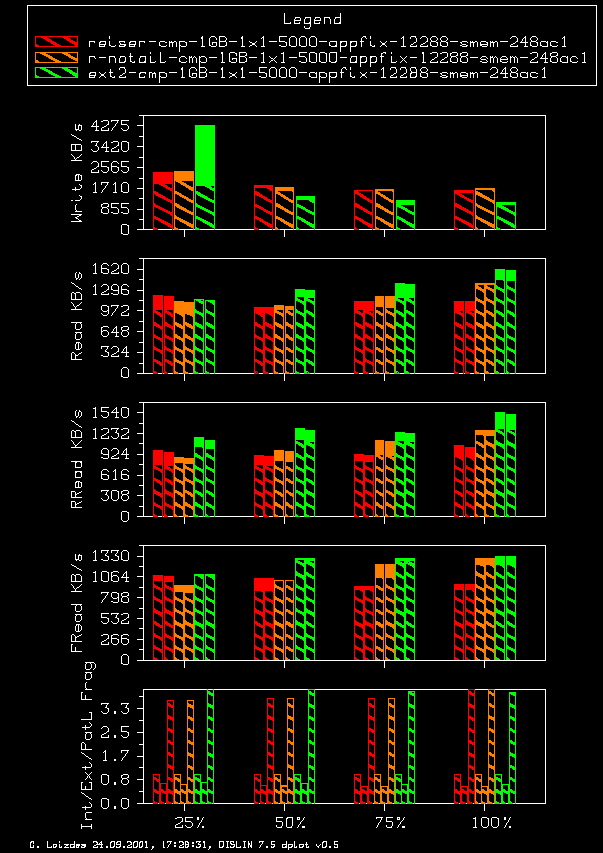
Fixed Append Size Results
- Partition Size: 1 GB
- File systems: Reiser, Reiser with -o notail and Ext2
- Fixed append sizes: 4K, 12K, 64K
- Number of total files: 1000, 5000, 10000, 25000
- Directory structures: 1x1
The following links show results and graphs for the different partition fullness:
- 50 % partition
- 75 % partition
- 100% partition (full partition of 1GB)
Low Statistics (but better than no statistic at all)
Some statistical results for 5000 files taken over three samples (only):- 4096 Bytes:
4096 appended
4096 copied
4096 compared - 12288 Bytes:
12288 appended
12288 copied
12288 compared - 65536 Bytes:
65536 appended
65536 copied
65536 compared
Variable Append Size Results
- Partition Size: 1 GB
- File systems: Reiser, Reiser with -o notail and Ext2
- Append size distribution: as in the agesystem section
- Number of total files: 1000, 5000, 10000, 25000
- Directory structures: 1x1
- 1000 files:
1000 appended
1000 copied
1000 compared - 5000 files:
5000 appended
5000 copied
5000 compared - 10000 files:
10000 appended
10000 copied
10000 compared - 25000 files:
25000 appended
25000 copied
25000 compared
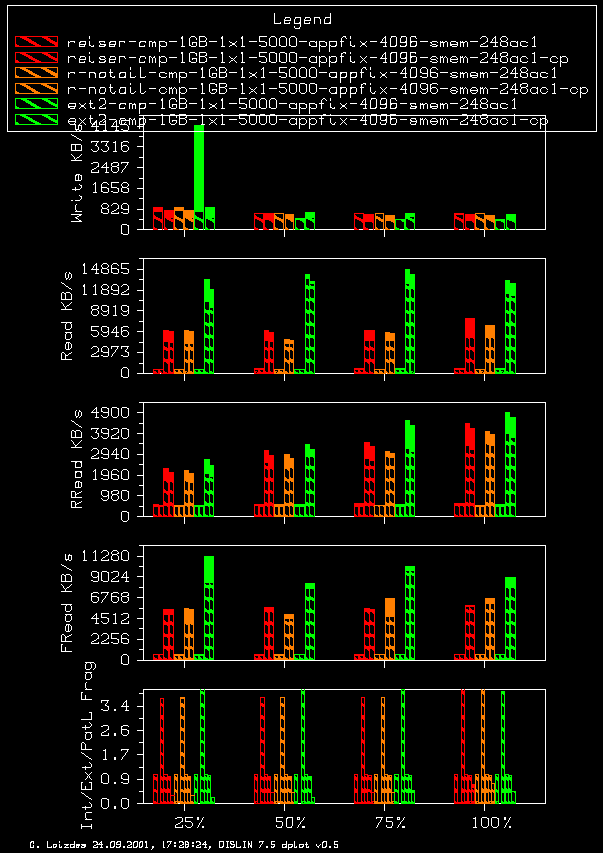
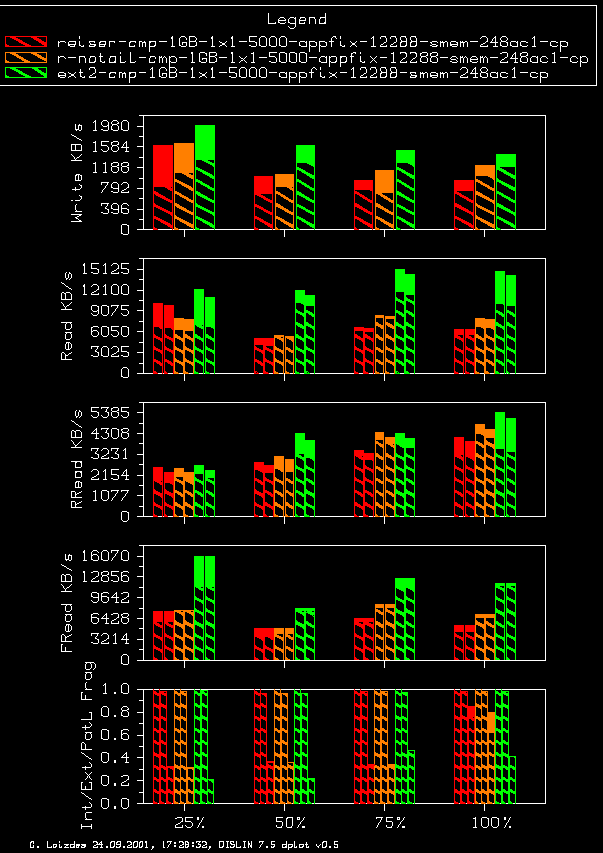
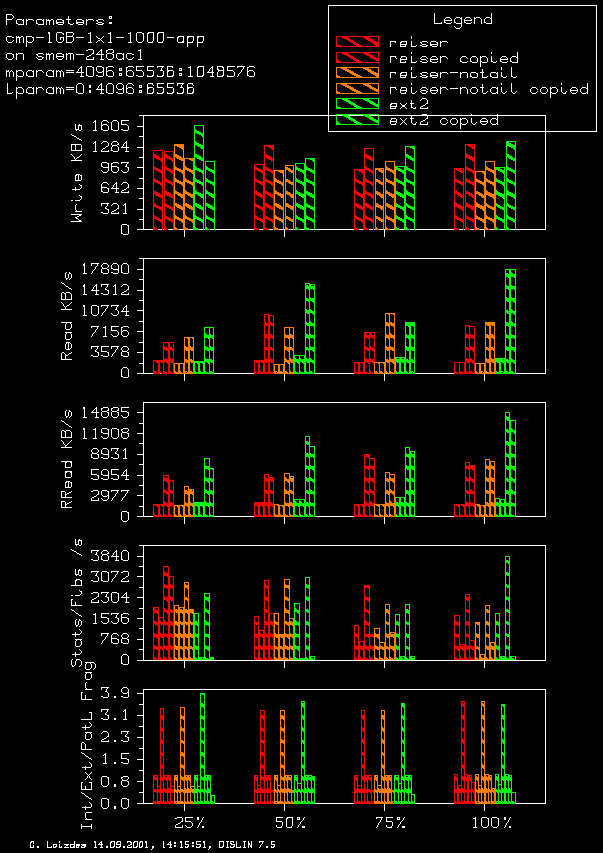
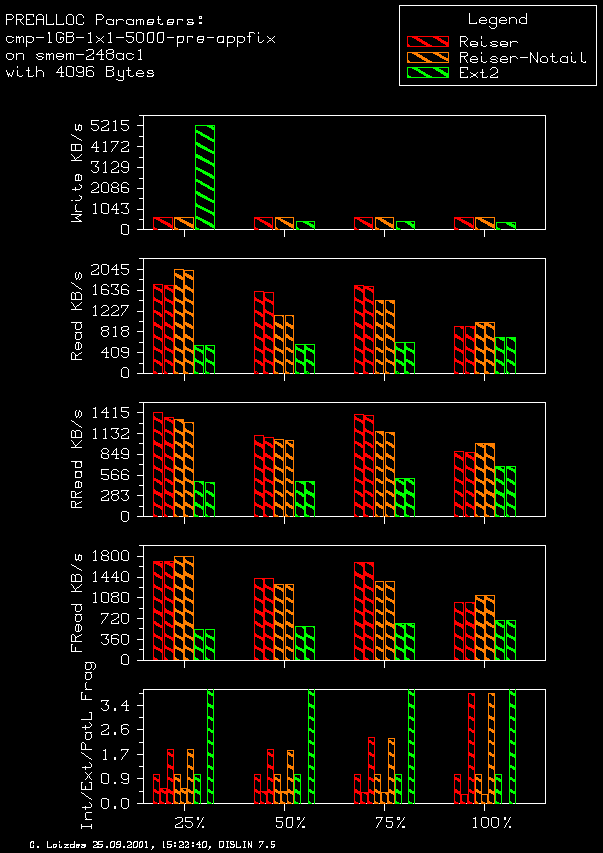
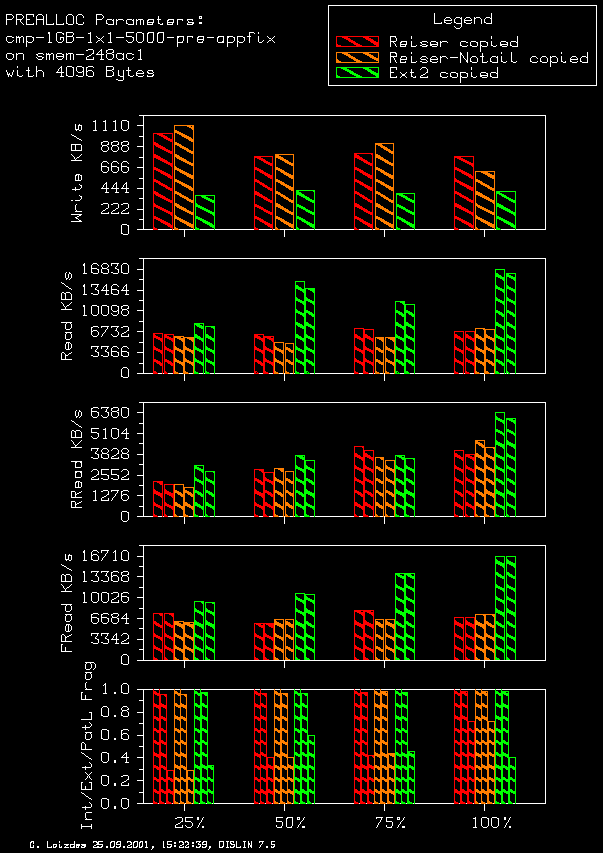
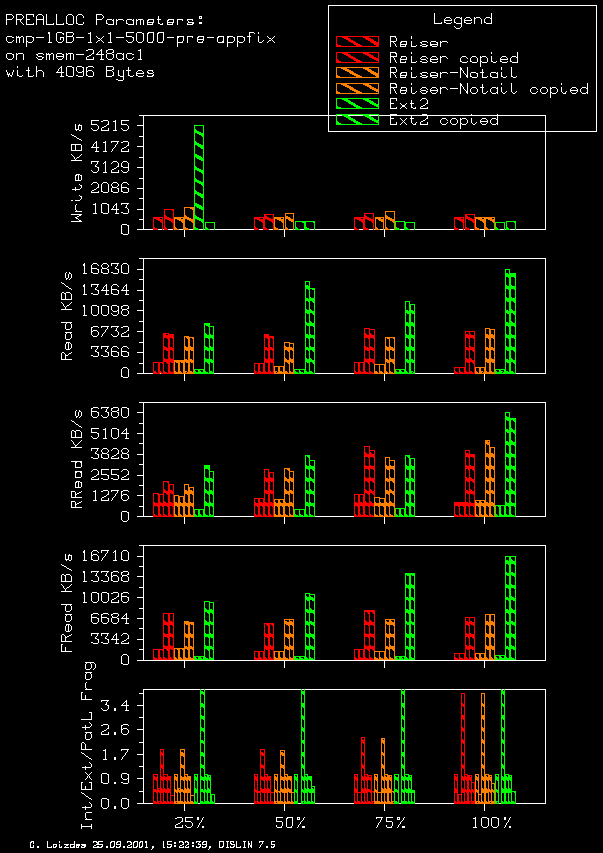
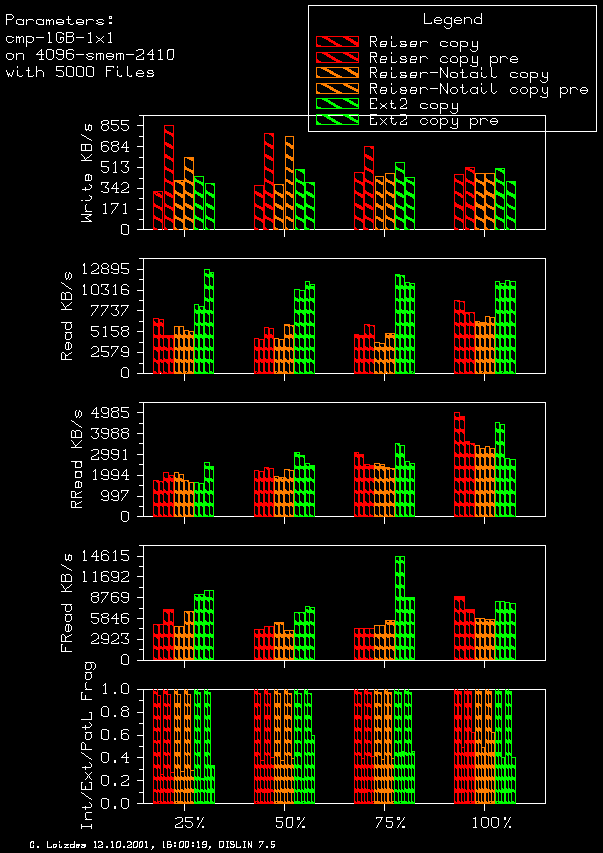
With Preallocation
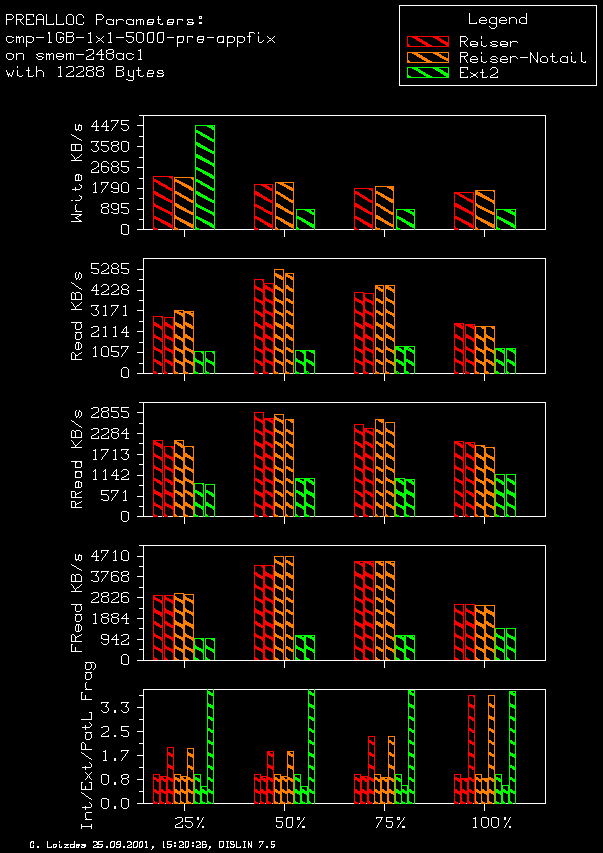
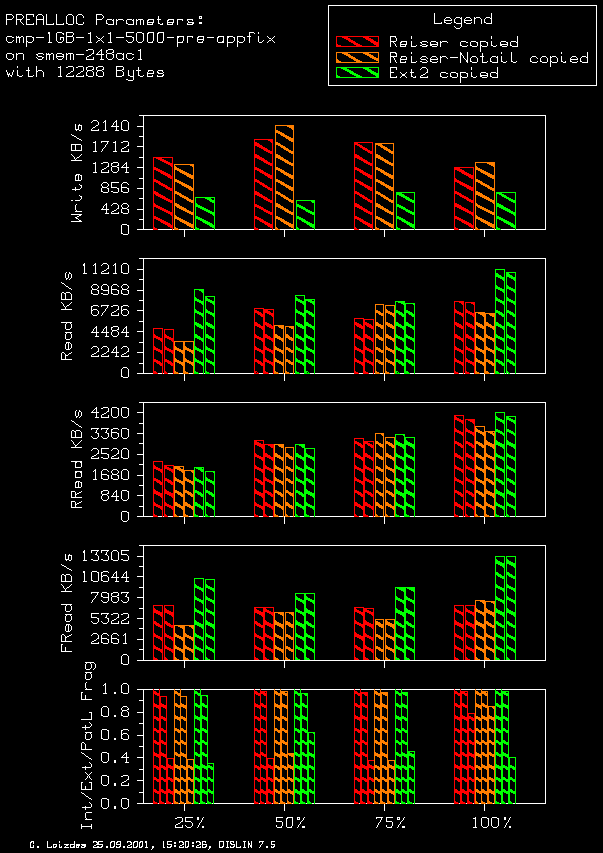
To improve the performance of the file system in which the files one by one in turn are appended by a fixed amount of bytes I set up the same settings as described above. The difference is that the files are first preallocated to their expected length and then truncated to the first block before starting to append. Using this trick I hope to give the file system under question a hint for the block layout. The expectation is that the fragmentation gets lower and at least the read performance higher.Graphical Output Explanation
The shown output is the same as the output above. Only the fifth row differs.- The fifth row is the FRead performance. It is the read performance when the files are read in the order which is given by their logical block numbers sorted in an ascendant order. Files with logical first block number of zero (eg. tails) are omitted (see also the read section).
Fixed Append Size Results (with prealloc)
- Partition Size: 1 GB
- File systems: Reiser, Reiser with -o notail and Ext2
- Fixed append sizes: 4K, 12K, 64K
- Number of total files: 5000
- Directory structures: 1x1
- 4096 Bytes:
4096 compare with/without prealloc
(4096 the same copied)
4096 pre appended
4096 pre copied
4096 pre compared
- 12288 Bytes:
12288 compare with/without prealloc
(12288 the same copied)
12288 pre appended
12288 pre copied
12288 pre compared
- 65636 Bytes:
65536 compare with/without prealloc
(65536 the same copied)
65536 pre appended
65536 pre copied
65536 pre compared
Measurements on 2.4.10
Test System
The hardware and settings are the same as in the gauge section.
- AMD Duron 650 Mhz, 128 MB, 40 GB EIDE-harddisk for the system with the tests taken on
- Adaptec AHA-2940U2/W host adapter
- 9 GB IBM DNES-309170W SCSI-harddisk
- Software: SuSE 7.2 (gcc 2.95-3) kernel 2.4.8-ac1 restricted to 32 MB memory without swap.
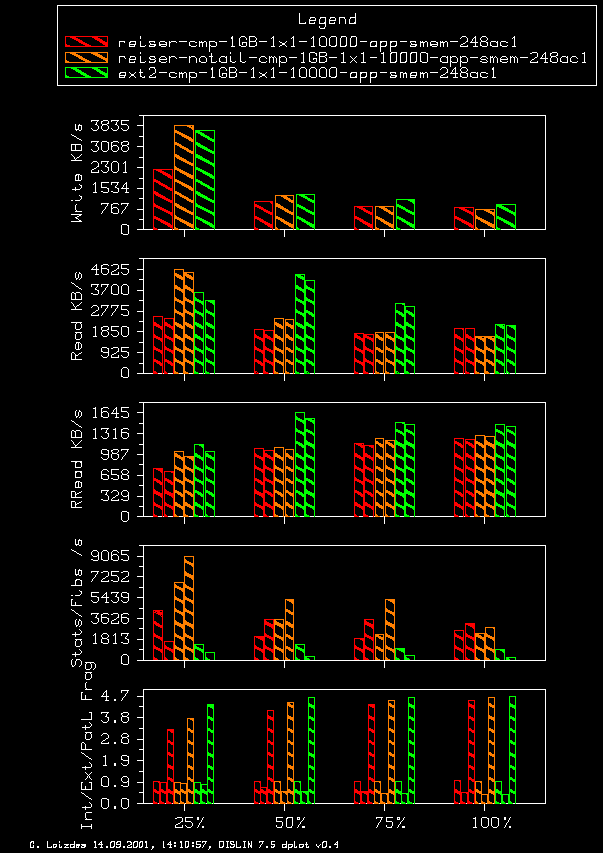
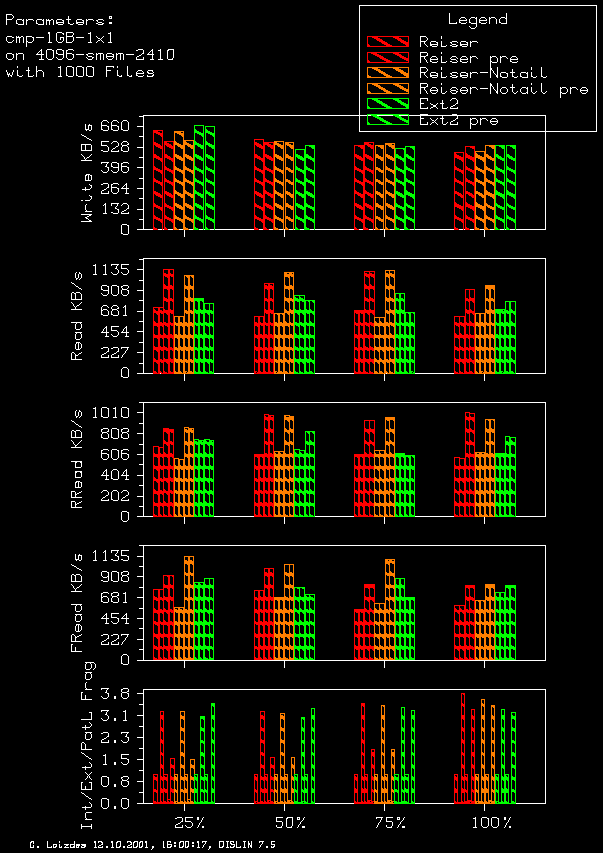
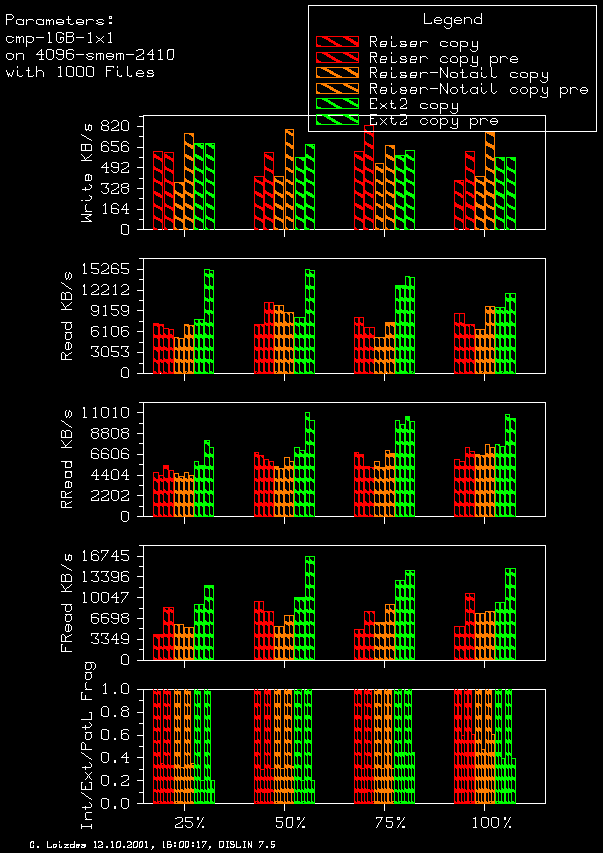
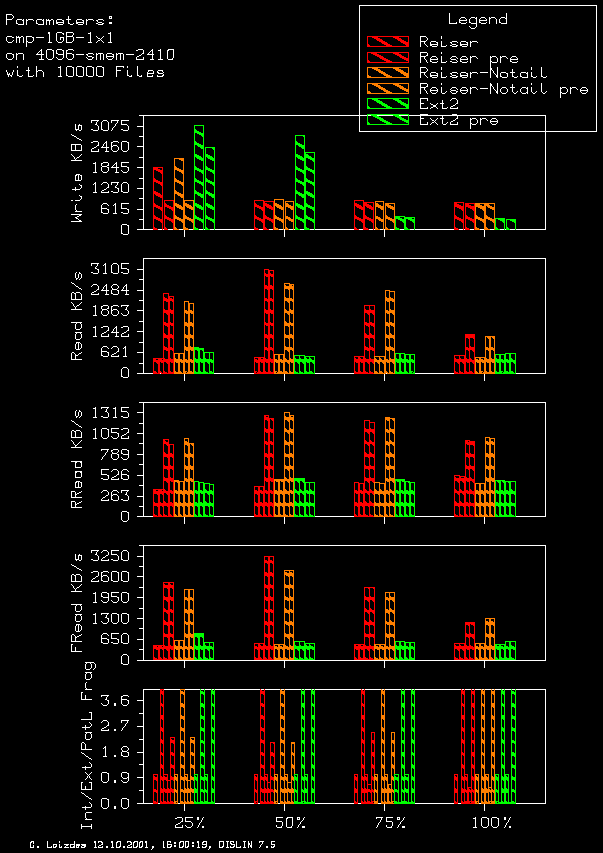
Graphical Output Explanation
The shown output is the same as the output above. Only the fifth row differs.- The fifth row is the FRead performance. It is the read performance when the files are read in the order which is given by their logical block numbers sorted in an ascendant order. Files with logical first block number of zero (eg. tails) are omitted (see also the read section).
Fixed Append Size Results
- Partition Size: 1 GB
- File systems: Reiser, Reiser with -o notail and Ext2
- Fixed append sizes: 4K
- Number of total files: 1000, 5000, 10000
- Directory structures: 1x1 1x1000
The following links show 1x1 results and graphs for the different partition fullness:
- 50 % partition (1x1,2.4.10)
- 75 % partition (1x1,2.4.10)
- 100% partition (1x1,2.4.10) (full partition of 1GB)
- 50 % partition (1x1000,2.4.10)
- 75 % partition (1x1000,2.4.10)
- 100% partition (1x1000,2.4.10) (full partition of 1GB)
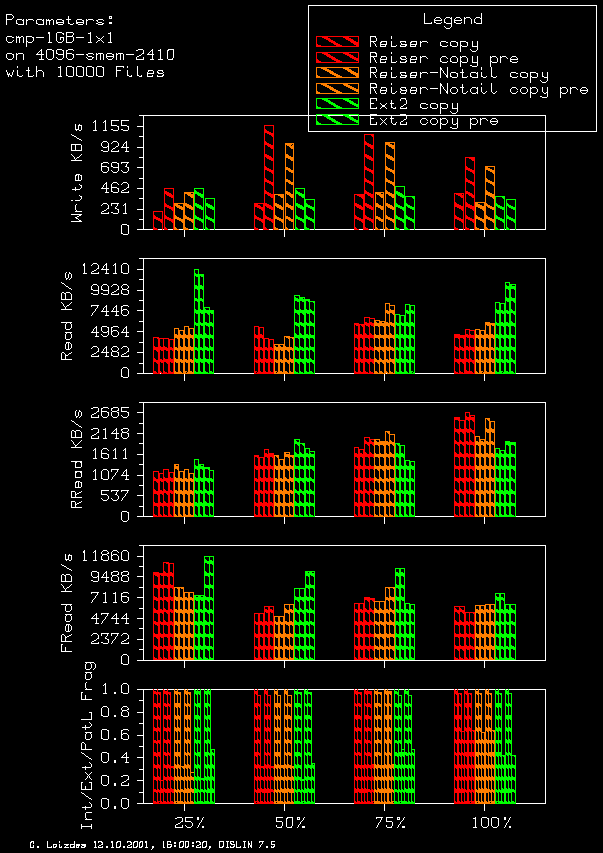
With Preallocation
To improve the performance of the file system in which the files one by one in turn are appended by a fixed amount of bytes I set up the same settings as described above. The difference is that the files are first preallocated to their expected length and then truncated to the first block before starting to append. Using this trick I hope to give the file system under question a hint for the block layout. The expectation is that the fragmentation gets lower and at least the read performance higher.Graphical Output Explanation
The shown output is the same as the output above.Fixed Append Size Results (with prealloc)
- Partition Size: 1 GB
- File systems: Reiser, Reiser with -o notail and Ext2
- Fixed append sizes: 4K
- Number of total files: 1000, 5000, 10000
- Directory structures: 1x1, 1x1000
The following links show 1x1 results and graphs for the different partition fullness:
- 50 % partition (1x1,2.4.10)
- 75 % partition (1x1,2.4.10)
- 100% partition (1x1,2.4.10) (full partition of 1GB)
- 1000 Files: 1000 compare with/without prealloc (1000 the same copied)
- 5000 Files: 5000 compare with/without prealloc (5000 the same copied)
- 10000 Files: 10000 compare with/without prealloc (10000 the same copied)
From the 1x1000 case one can deduce that when putting in each directory only one file which is subsequently appended does not give a significant performance gain using the preallocation trick. Having 5 or 10 files per directory again gets the factor two of performance gain back when using the preallocation trick
The following links show 1x1000 results and graphs for the different partition fullness:
- 50 % partition (1x1000,2.4.10)
- 75 % partition (1x1000,2.4.10)
- 100% partition (1x1000,2.4.10) (full partition of 1GB)
- 1000 Files (1x1000): 1000 compare with/without prealloc (1000 the same copied)
- 5000 Files (1x1000): 5000 compare with/without prealloc (5000 the same copied)
- 10000 Files (1x1000): 10000 compare with/without prealloc (10000 the same copied)